Use Old Methods to browse the established estimation formulas available in the selected system, inspect their assumptions and limitations, and compare their estimates with historical project weights. Where a method is suitable, you can use its estimate for the weight group currently open in the Estimation window.
In the Estimation window, select Estimate > Old Methods.... The browser initially selects the active weight group and prefers a method matching the current project type, where one is available.
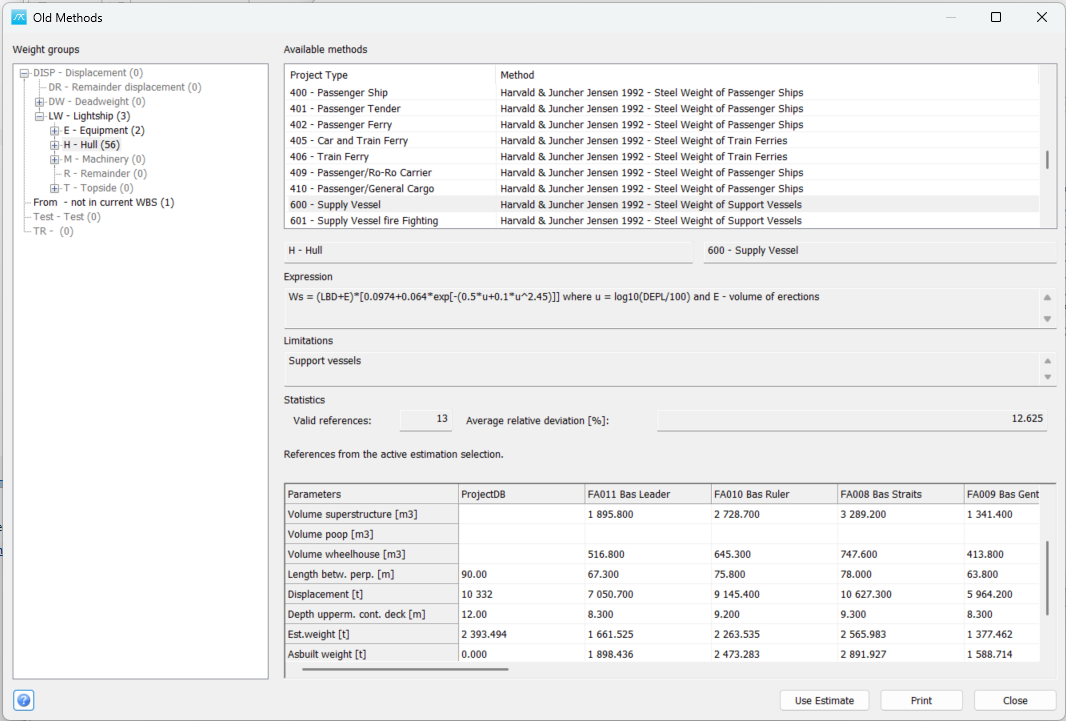
Find a method
The window has a weight-group tree on the left and an Available methods list on the right:
Area |
Use |
Weight groups |
Browse the complete weight-group hierarchy of the current project. The number in parentheses is the number of method entries defined directly for that group. Separate entries for different project types are counted separately. For example, H – Hull (56) means that 56 entries are available for H; it does not include methods defined for H1 or other subgroups. |
Grey groups / (0) |
These groups have no methods defined directly for them. You can still select or expand them to navigate the hierarchy. Selecting one clears the previous method selection and results. |
Project Type / Method |
Select a row to inspect that project-type and method combination. The list shows all available project types for the selected group, including types different from the current project's type. |
Expression / Limitations |
Read the selected formula and its stated scope before interpreting the result. A calculated value alone does not establish that the method is suitable for your project. |
An entry marked not in current WBS has method definitions in the system but is not a weight group in the current project's hierarchy. It is available for inspection.
Resize or maximise the window to make more room. Drag the vertical divider to change the tree width, or the horizontal divider below the method list to change the space available for the list and details. Use the scrollbars to read long formulas, limitations and comparison tables.
Read the comparison
The table shows the parameters required by the selected method, followed by the calculated results. The current project has its own column; historical reference projects appear in the following columns.
When the method matches the active estimation group and project type, the reference projects come from the active selection in the Estimation window, retaining its filters. When you browse another group or project type, the browser loads historical references for the selected method instead. The information line above the table identifies which selection is being used.
Result |
Meaning |
Est.weight |
The weight calculated by the selected formula using that project's parameters. |
Asbuilt weight |
For a historical reference, the recorded weight for the selected group. In the current-project column, this row shows the group's existing weight; it need not be a final as-built value. |
Abs.deviation |
Recorded or existing weight minus estimated weight. Positive means that the recorded weight is higher; negative means that it is lower. This is a signed difference, despite the row label. |
Rel.deviation [%] |
(Recorded or existing weight − estimated weight) / estimated weight × 100. |
N/A |
A result cannot be calculated reliably, for example because required parameters are missing or the formula gives an invalid result. The reason is shown where available. Invalid reference comparisons are excluded from the statistics. |
Valid references is the number of historical comparisons included in the average. It may be smaller than the number of reference columns. Average relative deviation [%] is the arithmetic mean of their signed relative deviations; it is not a standard deviation or an uncertainty measure. The current-project column is not included in this average. If there are no valid comparisons, the average is shown as N/A.
Example: interpret the deviation correction
Reference |
Estimated weight [t] |
Recorded weight [t] |
Relative deviation |
A |
1,000 |
1,200 |
+20% |
B |
1,000 |
900 |
−10% |
The average relative deviation is (20 − 10) / 2 = +5%. If the method estimates the current group at 2,000 t, accepting the average-deviation correction gives 2,000 × 1.05 = 2,100 t. Declining the correction uses the uncorrected estimate of 2,000 t.
Use this comparison as a reasonableness check. A small signed average can result from positive and negative deviations cancelling each other, so also inspect the individual reference results and the method's limitations.
Use an estimate
Browsing groups and methods does not change project weights. Use Estimate is available only when the selected method matches the active estimation weight group and applies to the current project type, the current-project calculation is valid, and the target group is not a summed group. A matching main project-type method may also be applicable. Selecting another group or an incompatible type is for review only.
1. Return to the group and method applicable to the active Estimation window. Check the current-project parameters, expression, limitations and reference comparisons.
2. Click Use Estimate and review any confirmation about replacing the existing weight.
3. If a valid average deviation is available, choose whether to apply it to the estimate. If no valid average is available, you may confirm use of the uncorrected estimate. Invalid estimates or corrections are rejected.
4. Review the resulting group weight and any dependent project totals.
Use Estimate changes the current project's weight. Close closes the window; it does not undo an estimate already applied. To use a method for a different group, first open that group in the Estimation window and check that the method applies to the project's type.
Print and close
Click Print to open print preview for the selected method information and calculated summary. Printing requires Estimate > Output permission. Click Close to leave the browser.
See also: 3.2 The Estimation window; 3.3 Filter Coefficients in the Graph.
See also: 3.2 The Estimation window
For reference filtering, see 3.3 Filter Coefficients in the Graph