To create a weight distribution curve it is important that all the items in ShipWeight are given an extent for each item. This extent can be set for each item or a default value can be applied.
Setting the extent for each item
When you are estimating or registering weight items, the extent of the item can be given in all directions x,y,z. In ShipWeight the extension of an item are given by the following parameters:
LCG_min (X_min, Aft)
LCG_max (X_max, Fore)
VCG_min (Z_min, Lower)
VCG_max (Z_max, Upper)
TCG_min (Y_min, PS)
TCG_max (Y_max, SB)
Together with the Center of Gravity of the weight item, this will make a trapezoid approximation to the weight distribution for that single item. When summarizing all the approximated distributions, a weight distribution curve for the total project is obtained. The extent for a subjective item, an estimate or a percentage is set in the main window. Marked with red in the picture below.
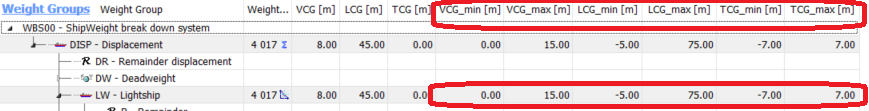
The extent for an item is set in the item window. Marked with red in the picture below.
![]()
Setting default extent for items
It is important that all items are given values for the start point and end point of the item: LCG_min, LCG_max, TCG_min, TCG_max, VCG_min and VCG_max. If an item lacks one of these values, the default value for extension will be applied. The default extension value is set in the Options window, on the tab Weight Distribution Curve.
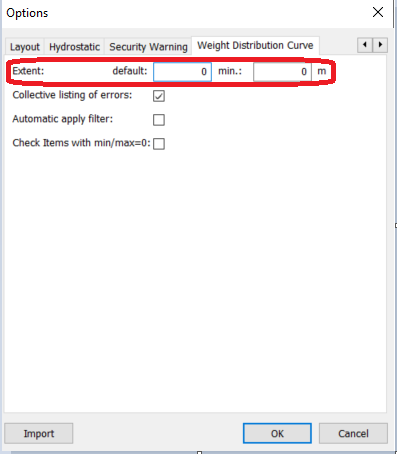
Two values can be given for Extent: default and min.
The default value is applied if any of the values LCG_min, LCG_max, TCG_min, TCG_max, VCG_min and VCG_max are missing.
Example: The ‘default’ extension value is set to 10 m:
|
Given value: |
Value used in wgt.dist. curve: |
LCG |
20 m |
20 m |
LCG_min |
Not given |
15 m |
LCG_max |
Not given |
25 m |
The min value will be used if the given extension of a weight item is less than the minimum value.
Example: The ‘min.’ extension value is set to 2 m:
|
Given value: |
Value used in wgt.dist. curve: |
LCG |
25 m |
25 m |
LCG_min |
24.8 m |
24 m |
LCG_max |
25.2 m |
26 m |
Weight Distribution Window
The Weight Distribution window is opened from the View menu by selecting Weight Distribution… . Alternatively, click the Weight Distribution Curve button on the toolbar: ![]()
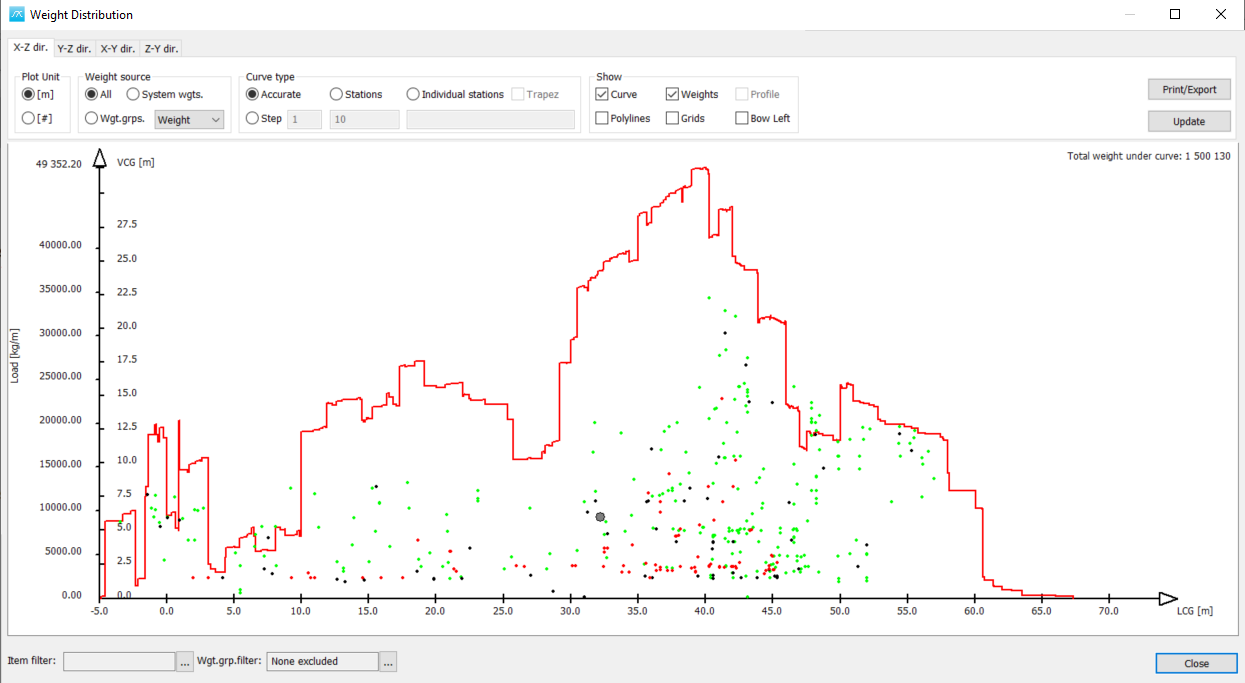
On the top there are 4 tabs where you select which direction you would like to see for the weight distribution curve. The Weight distribution curve can be plotted in longitudinal, transverse and vertical direction. To change the direction of the weight distribution curve, simply click one of the tabs X-Z-dir, Y-Z-dir, X-Y dir. or Z-Y-dir.
For each of the curves there are multiple settings that can be selected.
Settings in the Weight Distribution Window
Plot Unit:
The weight distribution curve can be plotted either with metric/US or frame spacing as plot unit.

Weight Source:
Select the source for the weight calculation for creating the weight distribution curve.

Curve type:
Here you can select between the four ways of plotting the weight distribution curve. When entering the number values use tab to select the number you have written in.

Accurate: Plot the curve as accurately as possible.
Step: Set the step distance between each point of the curve. When entering the number values use tab to select the number you have written in.
Station: The curve is plotted with a given number of stations, set the number of stations below the radio button and remember to click tab after entering the number of stations.
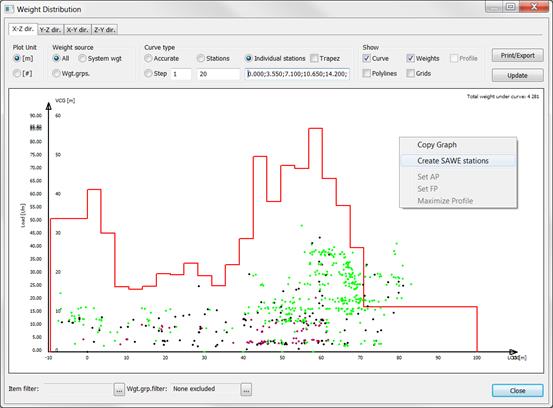
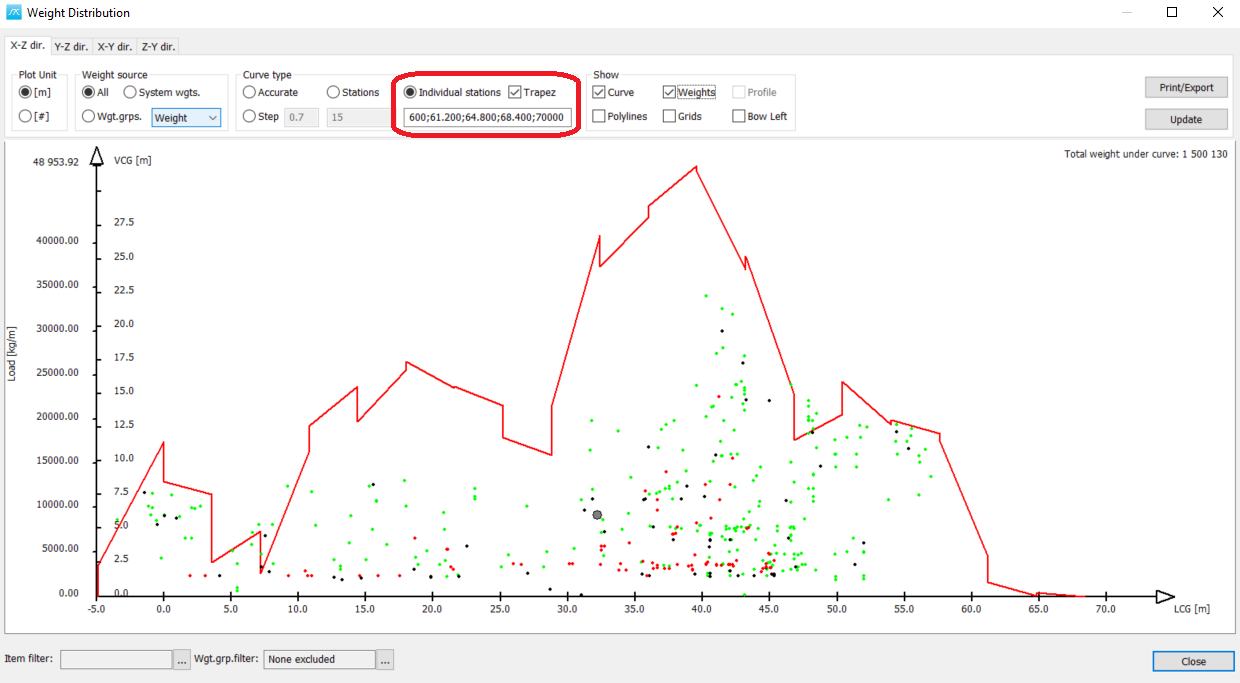
Individual stations: By setting Curve Type to “Individual Stations” you may individually set the start and stop points for the different stations of the weight distribution curve. The station setting is set on the format X1;X2;X3;…Xn where X is the LCG endpoint of each station (except the last station).
To automatically create a station profile that complies with SAWE (www.sawe.org) recommended practice 12, right-click the Graph area with the mouse and select Create SAWE stations from the sub menu. The SAWE stations will be stored under the individual stations setting and the radio button changes to Individual stations as well.
For Trapez aproximation of the curve select the checkbox next to Trapez.
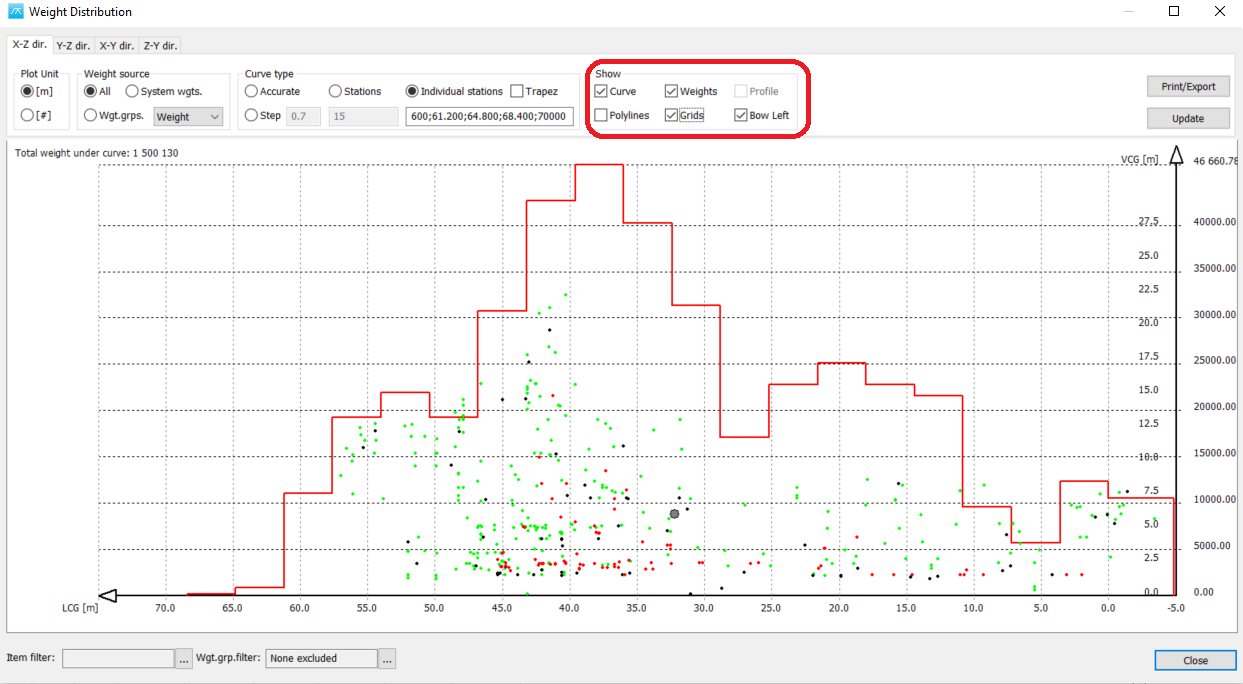
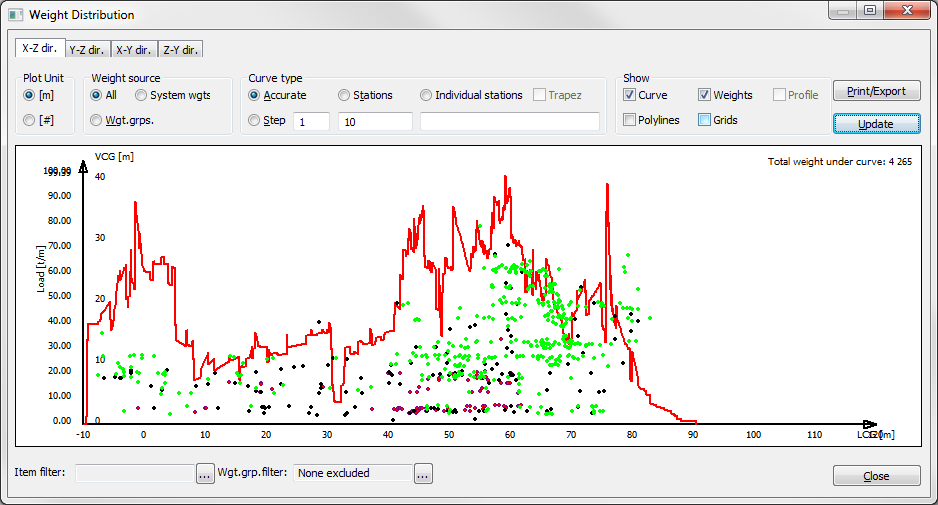
Show:
Select the different components to be shown in the graph. It is possible to combine them as you find useful. To copy the graph to clipboard right click the graph area and select Copy Graph.

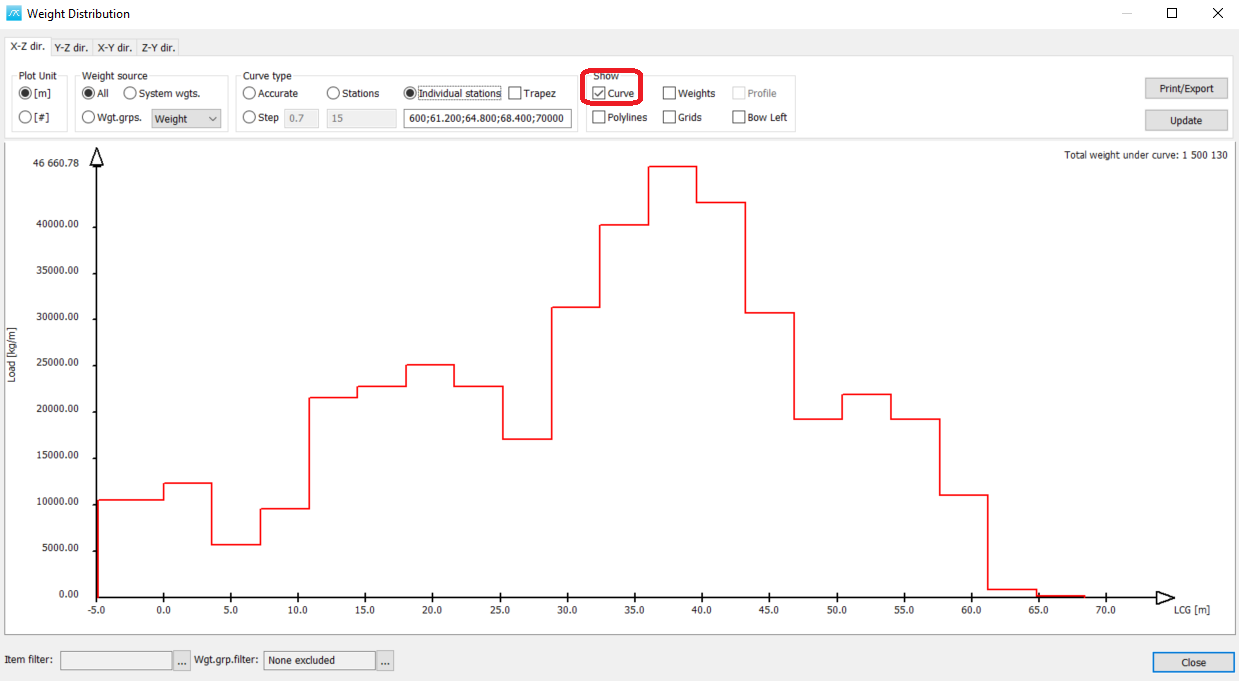
Curve: To show the weight distribution curve, check this check box.
Weights: If the Weights checkbox is checked, then all weight items will be plotted into the distribution area as a visual check.
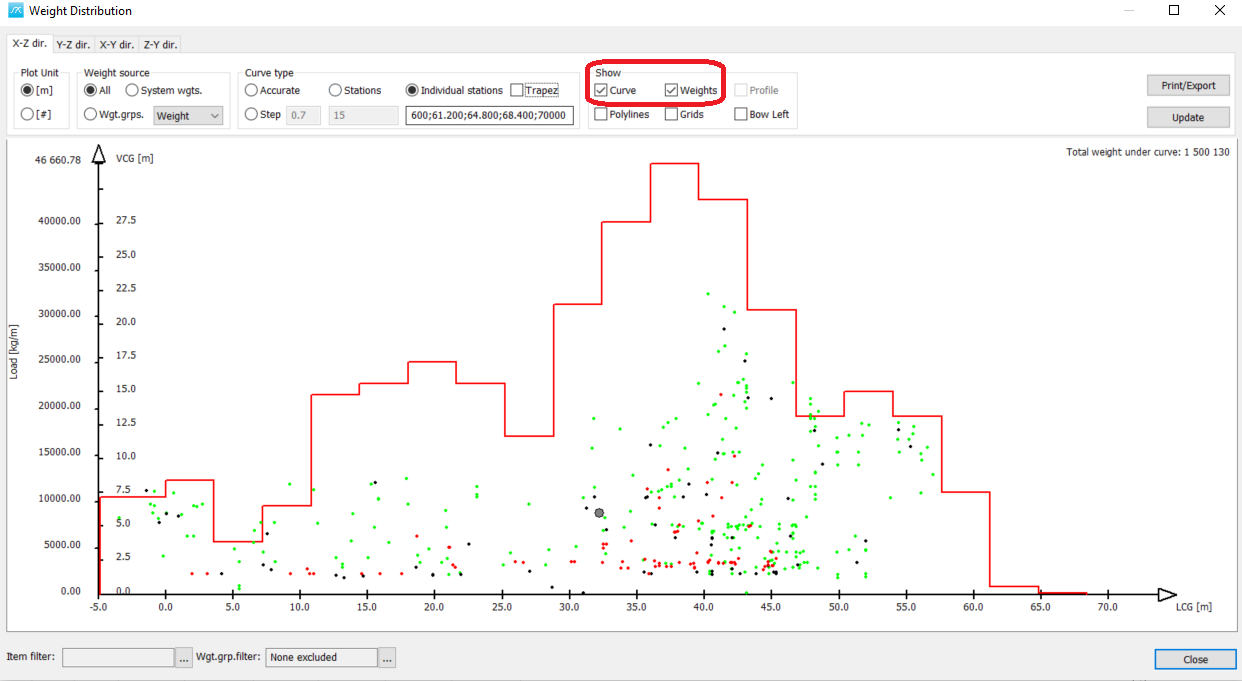
Each point in the graph will symbolize an item and its position. The green points are equipment items, the black points are steel items and the red points are machinery items.
By clicking on one of the points and holding the mouse button down, the user will get short information about the item. This way you can check any suspicious looking items and find errors. If you double click on one of the points the item window for the weight group of the clicked item will open, and the item double clicked will be highlighted.
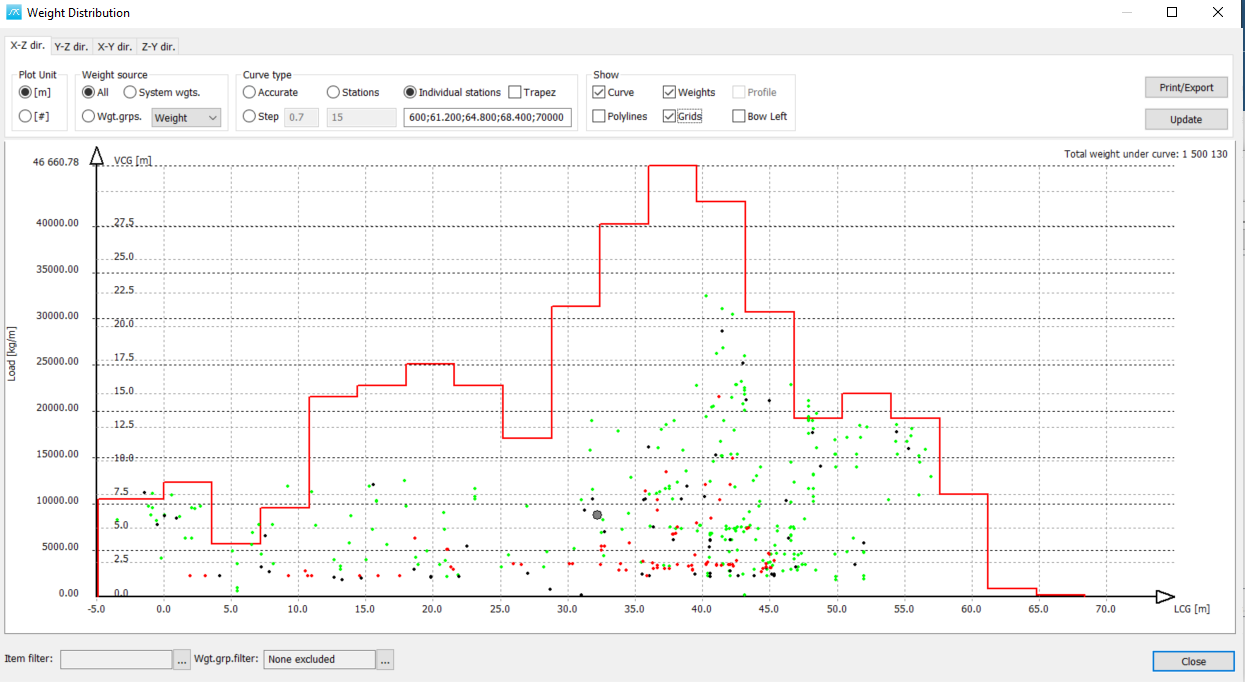
Grids: When checking the grids check box the grids for the graph will be turned on.
Bow left: If you rather would like to have the bow situated on the left side for the graph, click the Bow Left check box.
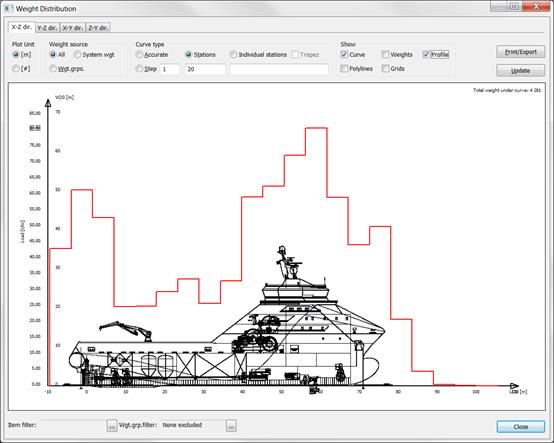
Profile:
To set a profile picture of the vessel into the graph right click in the graph area and click Select Profile File...

When a profile file is selected the Profile check box can be selected to show the profile in the graph. To scale the profile right-click the Graph area again and select Maximize Profile before selecting Set AP and Set FP to indicate on the drawing where the aft and fore perpendiculars are located. This way ShipWeight is able to scale the drawing correctly into the weight distribution curve.
Polylines:
If the Polylines checkbox is checked a sidebar pops up.
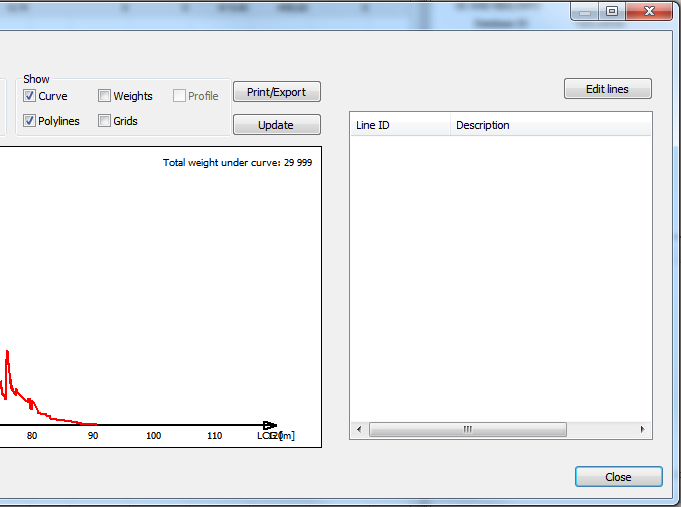
The window will extend to the right when Polylines is checked. In the tree structure that appears to the right, the appropriate parameters can be entered or edited by clicking the parameter in the window.
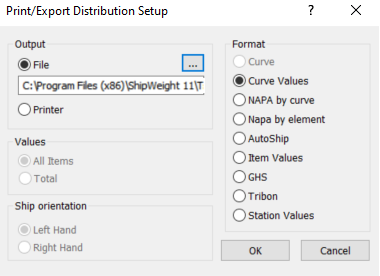
All to the right in the Weight Distribution window the buttons Print/Export and Update is situated.
Clicking the Print/Export button in the window makes it possible to send the curve to a printer or file, either graphically or numerically. It is also possible to export the weight curves in formats to be read by GHS, Tribon, NAPA and AutoShip.
The Update button updates the curve if changes have been made to the project after the distribution window has popped up.
More:
![]() Weight Distribution Calculations in ShipWeight
Weight Distribution Calculations in ShipWeight