Estimating Weight and CoG > The Estimation Window
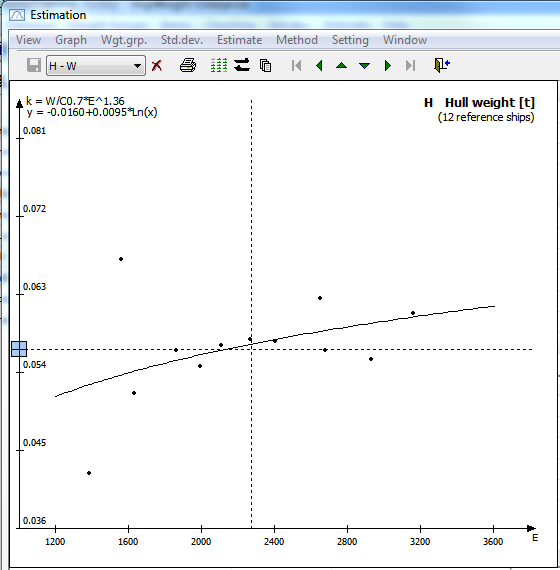
In the Graph area coefficients from vessels in the common historical database are plotted. The coefficients are plotted as black dots. The coefficient values can be read out of the vertical axis and they are plotted against a set of plot parameters on the horizontal axis. A regression line is plotted through the coefficients.
The vertical dashed line represents the plot parameter value for the project to be estimated. To examine a coefficient represented by a dot, the dot can be clicked, and this projects's parameters will be shown in the Comparison area.
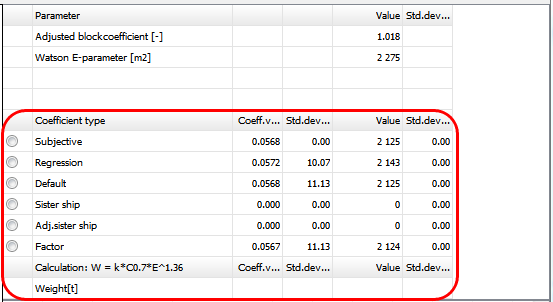
The way of selecting the coefficient in the Graph area is to use the Coefficient type window.