Introduction to Crystal Reports > Developing Own Crystal Reports
ShipWeight is delivered with a set of sample reports to be used with the Report Viewer. In many cases, the easiest way of creating your own report will be to modify one of the sample reports. This is especially useful if you just want to do minor changes such as inserting your company logo or change the formatting of a report.
In this session, we will create a new report from scratch using the ‘Report Creation Wizard’.
To start the wizard, you need to click the New Report button on the toolbar:
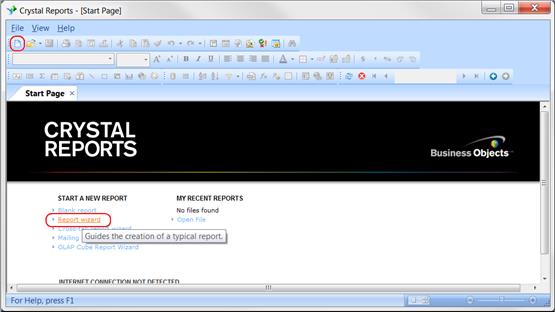
Now, the ‘Report Creation Wizard’ will appear. This wizard will guide you through the process of creating a report.
The first step is to choose the data you want to report on. Basically, this means choosing the database and tables to use in the report.
The Data window of the wizard contains a list of ‘Available Data Sources’ on the left side, and ‘Selected Tables’ on the right side.
In the list of ‘Available Data Sources’, you first expand the branch named ‘Create New Connection’. This is done either by clicking the small plus sign or by double-clicking it with the mouse.
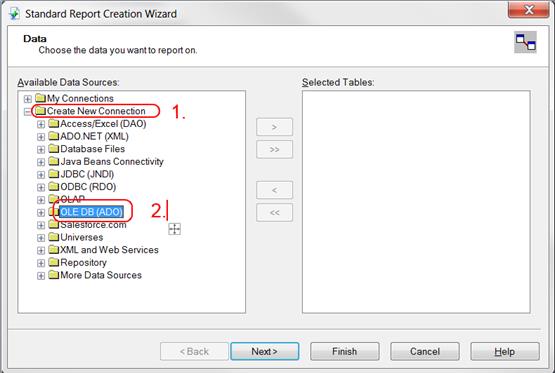
Next, you should expand the ‘OLE DB (ADO)’ branch. A new window-window titled OLE DB (ADO) will appear. This window is used to set up the connection to the database.
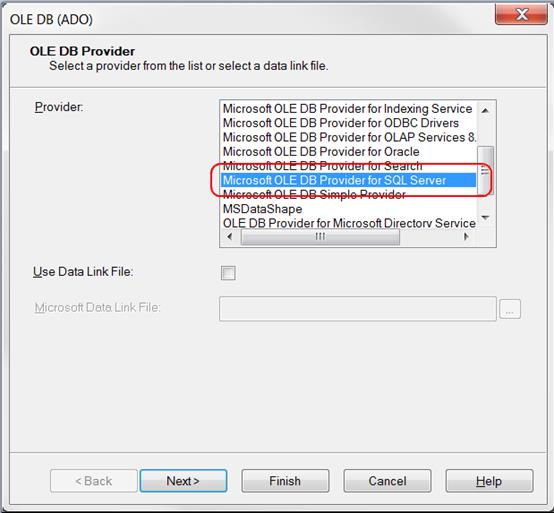
In the ‘Provider’- list, you should select ‘Microsoft OLE DB Provider for SQL Server’. Click the Next button to continue.
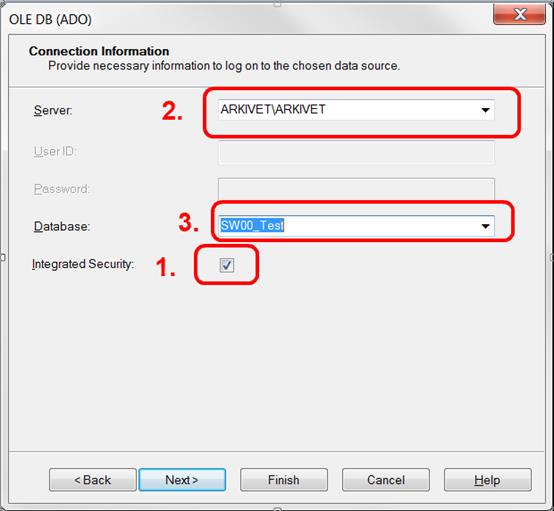
Now you will be asked to provide the necessary information to log on to the data source.
The first thing you need to do is to check the ‘Integrated Security’ button. When ‘Integrated security’ is selected, Crystal Reports will connect to the SQL database using your Window username and password. Now you will not need to enter the ‘User ID’ and ‘Password’.
Next, you should enter the name of the SQL server in the ‘Server’ field. Make sure to ask your database administrator for the name of the server containing the ShipWeight databases.
Now, select one of the available databases from the ‘Database’ dropdown list. Databases starting with SW0 are project databases.
For more information on the databases used in ShipWeight, please refer to the Chapter Introduction to the Databases.
Click the Finish button to close the ‘OLE DB’ window.
Back in the wizard, you will now find the database in the ‘Data Sources’ tree.
Double-click on the database name to expand the branch. Next, expand the ‘dbo’ branch. A list of the available tables will appear.
Now you need to drag-and-drop the ‘ITEM’-table’ to the ‘Selected Tables’ list at the right side.
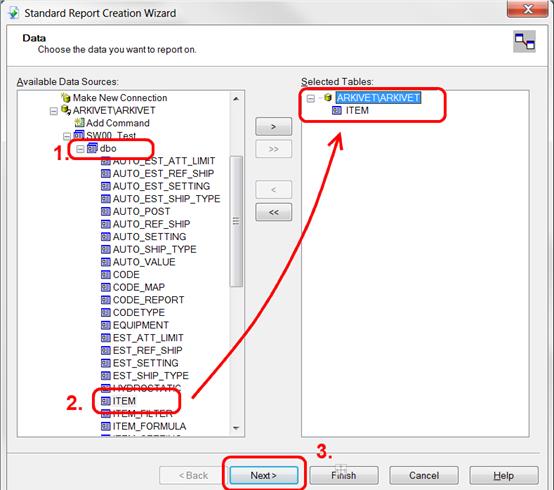
Click the Next button.
The next step of the wizard is to choose the fields to display in the report.
The wizard now shows two lists: ‘Available Fields’ and ‘Fields to Display’. The Available Fields list shows all the fields in the ITEM table.
To include fields in the report, simply drag-and-drop them to the ‘Fields to Display’ list.
You can re-arrange the order of the selected fields by simply dragging them to a new location in the ‘Fields to Display’-list.
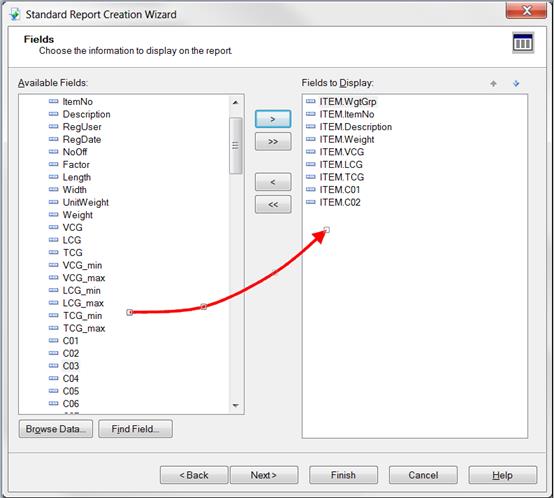
When you have selected the data you want in the report, click the Next button to continue to Grouping.
If you want to group the data in the report, simply drag-and-drop this field from the ‘Available’-list to the ‘Group By’ list.
In this example we will group on code C01, which is a Section code.
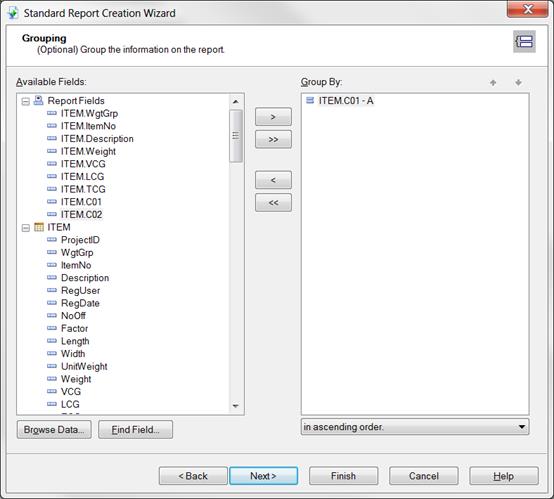
Click Next to go to the Summaries-part of the Wizard.
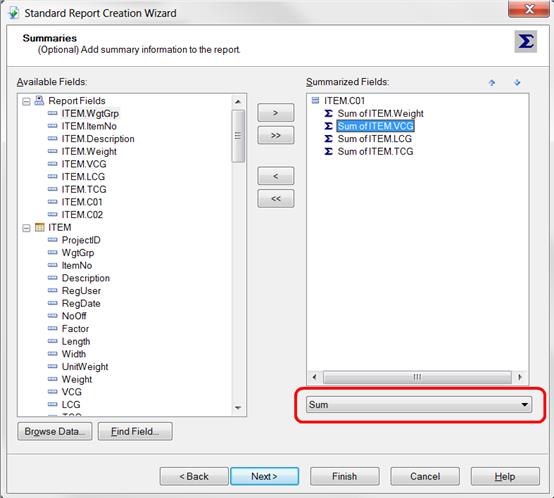
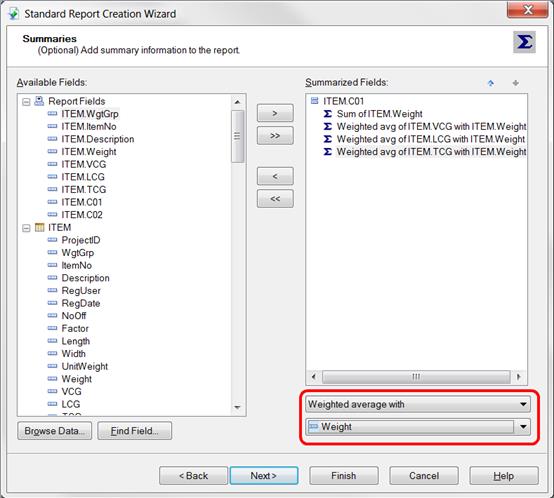
To add summary information to the report, simply drag-and-drop the field to the ‘Summarized Fields’-list.
All numerical fields in the report are automatically added to the ‘Summarized Fields’-list.
Please note that the default type of summary is Sum. Make sure to change summary type for VCG, LCG and TCG from ‘Sum’ to ‘Weighted average with Weight’.
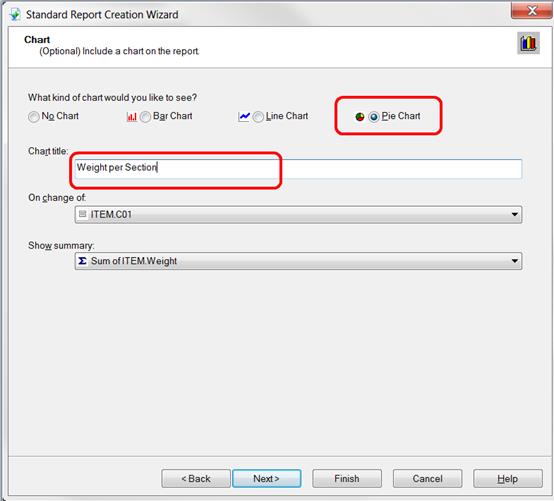
When you click the Next button, you come to the Group Sorting. We will not use group sorting in this example, so you should click the Next button once more to go to the Chart-section of the Wizard.
We will include a Pie Chart showing the Weight of each section. Select Pie Chart. Optionally you can change the Chart title.
Make sure the On change of field is set to ITEM.C01, which is our Section code in this example. Also check that Show summary is set to Sum of ITEM.Weight.
Click Next to go to Record Selection. You can use record selection to include only a part of the data from the database in the report.
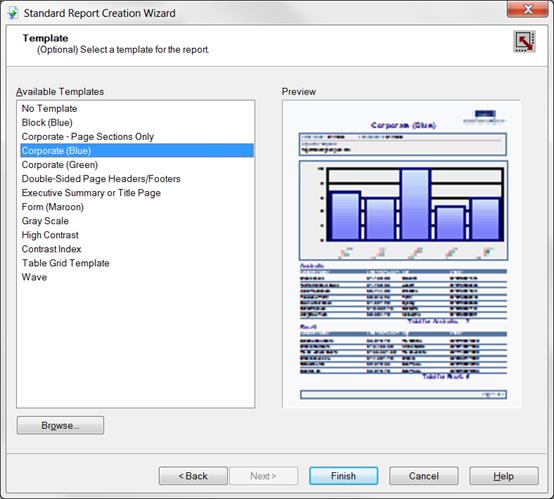
We will not be using record selection in this example. Click Next to continue to the last item in the wizard: Template.
Crystal Reports comes with a set of predefined templates. You can use one of these to quickly change the look of your report.
Click the Finish button to exit the Report Creation Wizard.