Default Regression Lines
Use Default Regression Lines to save and maintain regression lines for later comparison in the Estimation window. For example, you can preserve an agreed regression line and compare it with the regression calculated from a new selection of reference projects.
Saved lines are stored in the connected historical database for the relevant WBS. They are separate from the regression recalculated from the current reference-project selection.
Save a regression line
1. In the Estimation window, select the required weight group, method and reference projects.
2. Review the regression type and plotted results.
3. Choose Graph > Save Regression Line... .
4. Review the proposed settings and enter a descriptive Title.
5. Click Save to store the line.
The combination of WBS, weight group, weight-group type and title identifies the saved line. Saving with the same identification updates the existing entry. Use a different title to preserve both versions.
Inspect or edit saved lines
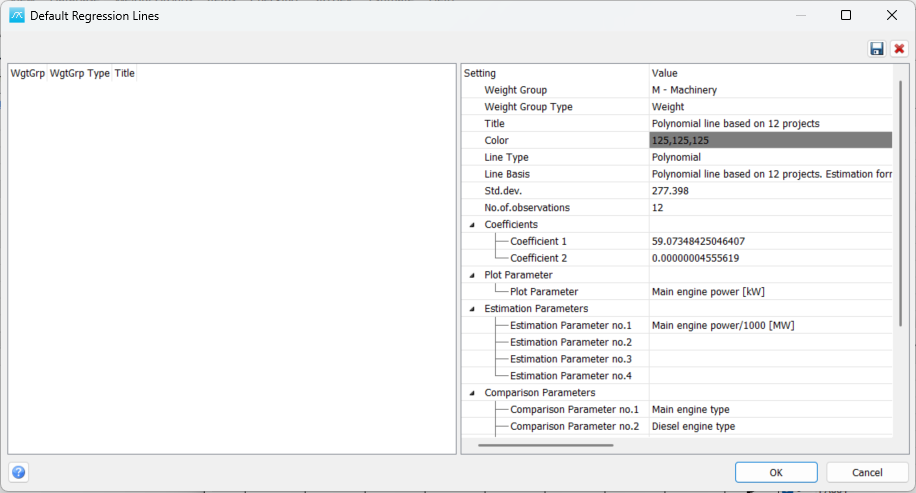
Choose Graph > Edit Regression Lines... . The left table lists saved lines by WgtGrp, WgtGrp Type and Title. Select a line to display its settings on the right.
Setting |
Description |
Weight Group / Weight Group Type |
The weight group and quantity to which the line applies: weight or a centre-of-gravity coordinate. |
Title |
A descriptive name identifying the saved line. |
Color |
The colour used to display the line. |
Line Type |
The regression function: Linear, Logarithmic, Exponential or Power. |
Line Basis |
A description of the calculation basis recorded when the line was saved. |
Std.dev. / No.of.observations |
The stored standard deviation and number of observations. |
Coefficients |
The numerical coefficients defining the regression function. |
Plot Parameter |
The parameter used for the horizontal axis. |
Estimation Parameters |
The parameters and powers used in the estimation expression. |
Comparison Parameters |
Additional parameters associated with the saved line. |
Min / Max |
Stored limits for the applicable parameter values. |
Finish editing each cell before saving. Changing a coefficient, parameter or power changes the meaning of the saved line; it does not perform a new regression analysis of the historical observations.
Display saved lines
In the Estimation window, use Graph > Show Regression Lines to select the saved lines to display. Compare lines only when their quantities, parameter definitions and calculation bases are suitable for the current estimate.
Displaying a saved line does not by itself select it as the coefficient source or replace the current estimate.
Save, delete and close
Click Save to store the current line settings. To remove a saved line, select it and click Delete, then confirm.
When you click OK, the program offers to save outstanding setting changes. It can also prompt you to save when switching between lines.
Cancel does not undo a Save or Delete action already performed. Since the lines are stored in the historical database, changes can affect other users of that database.