The Trendlines window shows how project weights develop across revisions. Compare the current project with earlier revision sources, examine the contributions from weight groups or custom codes, and display the estimate as a reference. Open the window from View > Trendlines.
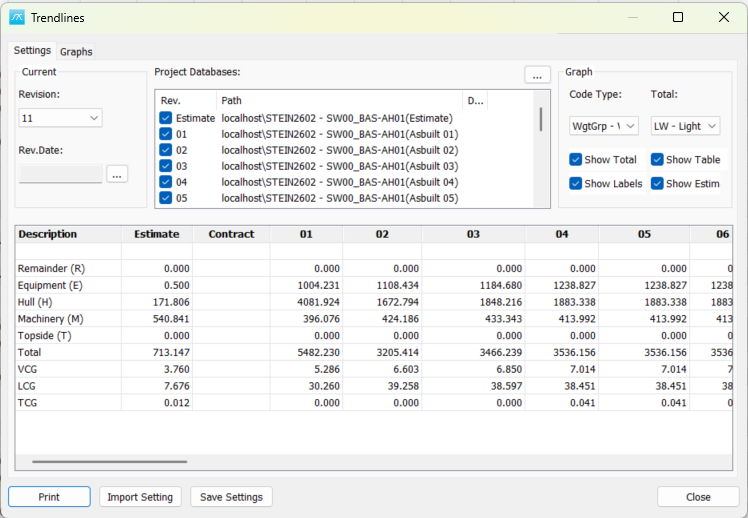
Set up the revision comparison
1. On Settings, select the Current Revision and set its Rev.Date with the (...) date button. The window supports revision numbers 01 to 20. The selected current revision reads its figures from the open project; earlier revisions read from the project sources assigned to them.
2. In Project Databases, select an earlier revision row and click (...) or right-click and choose Set Path... to select its source project. If prompted, select the required accumulated revision in that source. The Path column identifies the server, database and project, and may include a revision suffix.
3. Set the date for each revision with Set Date... in the list's context menu, or double-click its row. Dates describe the revisions; the graph positions its points by revision order rather than by elapsed time.
4. Check the revisions to include in the graph. Configure the Estimate row if you want an estimate reference. Use saved revision sources that represent the project at the relevant stage; linking several revision rows to the same changing project does not create historical snapshots.
5. Choose Code Type and Total, review the table, then open Graphs to inspect the development. Click Save Settings when the setup is ready.
Current Revision and Project Databases
Current Revision: Identifies which numbered revision represents the open project. Changing this selection updates the current-project entry in the source list and the figures in the table.
Rev.Date: Sets the date associated with the current revision. When you save the Trendlines settings, the selected current revision is also written to the project's revision if it differs from the existing revision.
Project Databases: Contains an Estimate source and up to 20 numbered revision sources. Select the appropriate row before assigning a source. Multiple selected rows can receive the same source or date, so check the selection before applying a change.
Set Path... and Delete Path assign or remove a source reference. Deleting a path does not delete the source project. Set Date... and Delete Date maintain the dates for numbered revision rows.
For projects with accumulated revisions enabled, Set Revision... and Delete Revision maintain the revision selection attached to a source. These commands are available from the source list's context menu.
Choose the breakdown
Code Type: Select the classification to compare. WgtGrp - Weight Breakdown System uses weight groups; the other choices use the project's custom code types.
Total: Select the parent weight group or code to examine. The table and graph show its immediate children, with the selected parent's total available separately. Choose a suitable parent if the graph has too many lines or no breakdown appears.
Use compatible code structures in the revision sources so that the same codes can be compared across revisions. The window reads the selected breakdown from project data; it does not create or edit code definitions.
Read the Settings table
The table lists the selected breakdown, its Total and the three centre-of-gravity coordinates. Columns include Estimate, Contract and revisions 01 to 20. The populated revision columns depend on the selected current revision and the configured source projects. Check that the table contains the expected figures before interpreting the graph.
Right-click the table and choose Update Table to read the source data again after changing a source project. Copy Table copies the table for use in another application.
Graph options
Graphs displays the weight development for the selected breakdown. Each line connects the included revision values for a child code or weight group. These are revision comparisons, not a fitted regression curve or a prediction of future weight.
Show Total: Adds the total for the selected parent alongside the child lines.
Show Table: Includes the numerical table with the graph in the printed report.
Show Labels: Adds labels to identify the plotted child lines.
Show Estimate: Adds a horizontal reference line for the selected parent's estimate. Assign the Estimate source and check its value in the table before using this comparison.

If a graph looks unexpected, check the selected current revision, included revision rows, source projects and revisions, and the selected Code Type and Total. Use Update Table after making changes to source data.
Save, import and print
Save Settings: Stores the revision sources, dates, inclusion choices and graph options in the current project. Saving also updates the project's revision to the Current Revision selection when necessary.
Import Setting: Imports Trendlines settings from another project. This writes the imported settings to the current project. Check the imported source references and revision choices before using them. Import requires permission to import weight information.
Print: Opens the graph report for preview and output. Select Show Table to include the numerical table in the report. Printing requires permission to output weight information.
Close: Closes the window and asks whether to save if the settings have changed.
Related topics
See The Code Definition Window for custom code types and code hierarchies.
See Project Log for the log of recorded weight and centre-of-gravity changes within a project.