Estimating Weight and CoG > The Estimation Window
The regression coefficient is the value calculated in the intersection between the regression line in the graph and the plot parameter for the weight group.
The default coefficient is shown by the dotted line in the graph. This coefficient is stored in the coefficient database (see Chapter Additional Databases/Libraries in ShipWeight), and are to be used if the basis for the other coefficient are none-existing or not satisfactory.
The sister project coefficient is the coefficient for the project selected as sister project in the Reference Projects window.
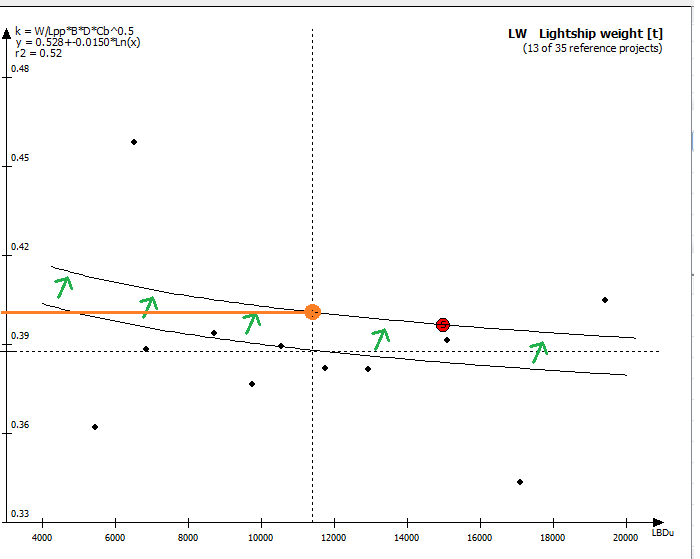
The adjusted sister project coefficient is the coefficient for the project selected as sister project in the Reference Projects window, but adjusted according to the trend in the regression line. This means that the trend line is translated (though not visually, only mathematically) to run through the sister ship coefficient, but still scaling according to the trend line. This is the same as putting extra “weight” on the sister ship when selecting the coefficient. In other words, you scale according to the sister ship, but still take into account trend line. In the picture the translation of the trend line is visualized and the selected coefficient is marked with orange.
The average coefficient is the average value of the coefficients in the graph. All coefficients are weighing equal when finding the average.