Introduction to Crystal Reports
There are two ways of reporting from ShipWeight: by using the standard reports and Crystal Reports.
The standard reports includes a Weight Item report, a Code report, a Weight Distribution report and a Weight tracking report to mention some. They are easily accessible from ShipWeight.
The standard reports are built into – or “hardcoded” into ShipWeight. This means that they are included in the ShipWeight-executable file. Therefore, a ShipWeight user cannot do any changes to these reports. The layout and the information to be included are locked.
Naturally, many ShipWeight users need custom made reports. To meet this need, ShipWeight includes a powerful reporting engine based on Crystal Reports. Crystal Reports by Business Objects is the industry leading report-software created.
ShipWeight includes a Crystal Reports viewer. Basically, the ShipWeight Reports window does three things:
1.reads a predefined report formatting file
2.extracts data from the current database
3.displays the report on screen
Once your report is displayed on screen, you can send the report to a printer or export the report to various file formats. This includes formats such as Microsoft Word DOC and RTF and Adobe PDF.
ShipWeight only comes with the viewer part of Crystal Reports. To be able to create your own reports, you must purchase the full version of Crystal Reports.
The full version of Crystal Reports is a powerful, yet easy-to-use, tool for designing reports. Using Crystal Reports, you set up a report template specifying:
1.what data the report should contain
2.the order the data should appear
3.the format of the report
You can easily insert graphics, such as your company logo, into the report. Also a variety of charts are available for use in your report.
When you created a report template, you save it as a .RPT file. Make sure to set up Crystal Reports so that data are not saved with the report. This means that the .RPT file will not contain any data – only the formatting of the report.
Now you can easily share your .RPT file with any ShipWeight user in your organization. Any user authorized to access the ShipWeight Report Viewer can run, view and print the report.
The Crystal Reports main window includes two main parts: The ‘Field Explorer’ and the Design Area.
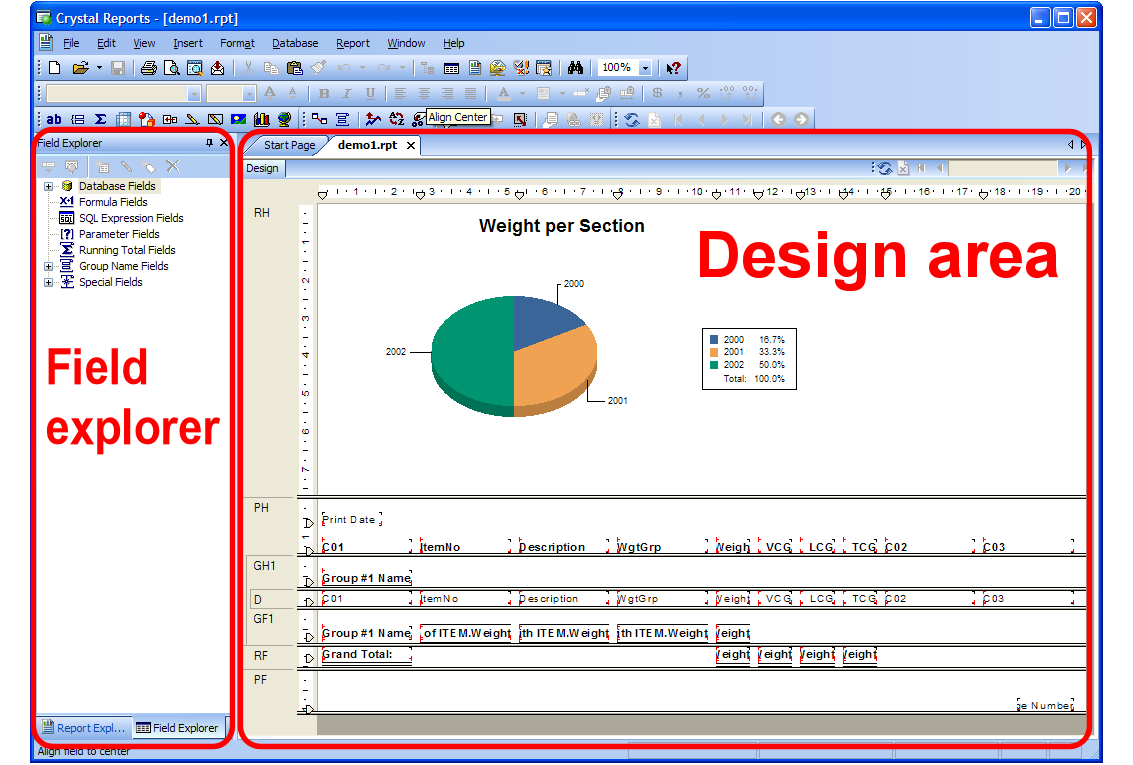
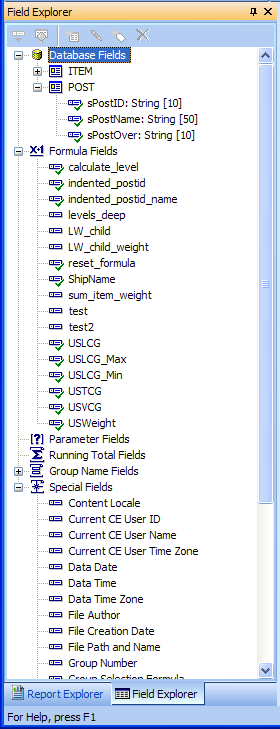
The Field Explorer includes all data that is available for use in the current report. This includes:
•Database Fields
•Formula Fields (calculated data)
•Parameter Fields (user input)
•Running Total Fields
•Group Name Fields
•Special Fields (page number, date etc.)
The easiest way of adding data to the report, is to simply drag it from the ‘Field Explorer’ into the Report.
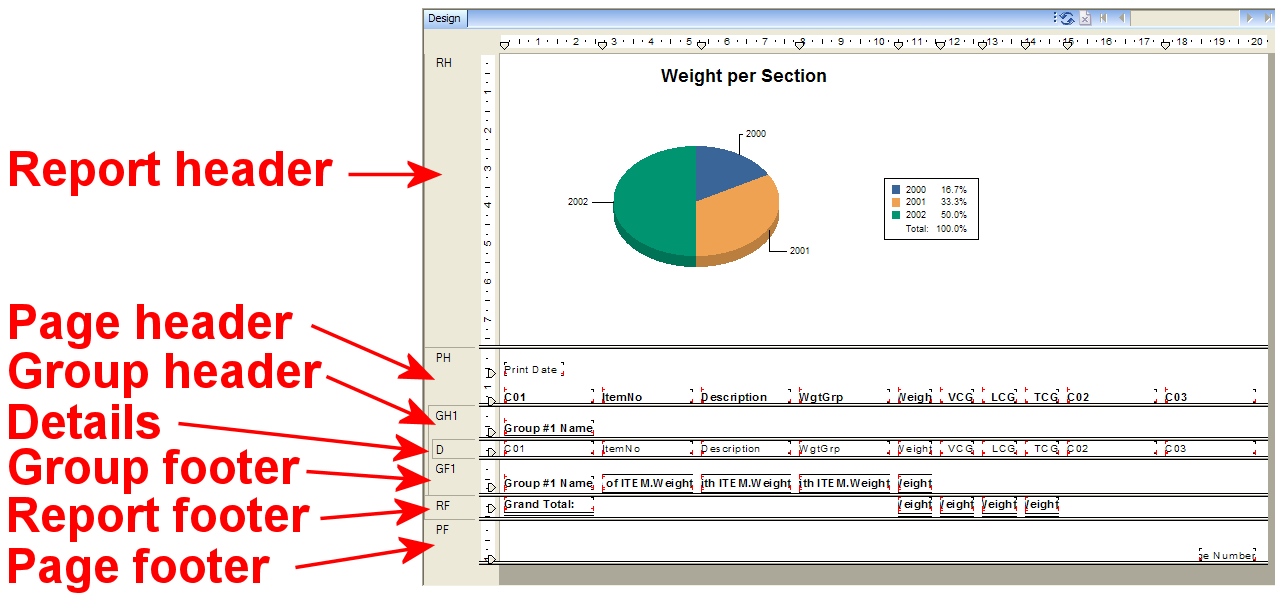
The design area at the right side is divided into several sections:
•Report Header First part of the report – For report title, chart, etc.
•Page Header Repeated on top of every page – For logo, date, etc.
•Group Header Repeated at the beginning of a group – For group title
•Details The main data of the report
•Group Footer Repeated at the end of a group – For group summary
•Report Footer Last part of the report – For report summary
•Page Footer Repeated at the bottom of every page
ShipWeight is delivered with a set of sample reports to be used with the Report Viewer. In many cases, the easiest way of creating your own report will be to modify one of the sample reports. This is especially useful if you just want to do minor changes such as inserting your company logo or change the formatting of a report.
In this session, we will create a new report from scratch using the ‘Report Creation Wizard’.
Step 1: Start a New Report Using the Wizard in Crystal Reports
To start the wizard, you need to click the New Report button on the toolbar:
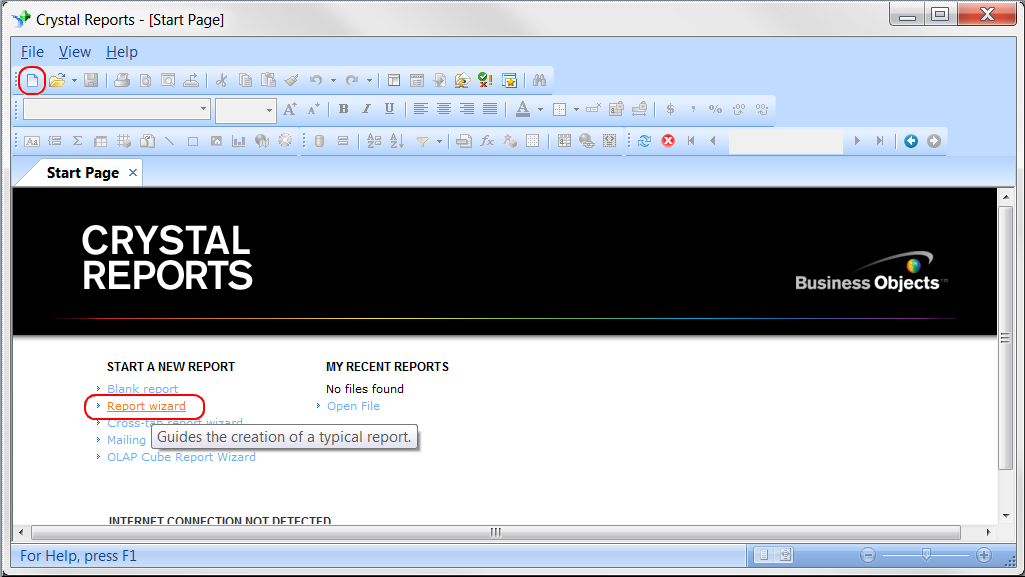
Now, the ‘Report Creation Wizard’ will appear. This wizard will guide you through the process of creating a report.
The first step is to choose the data you want to report on. Basically, this means choosing the database and tables to use in the report.
The Data window of the wizard contains a list of ‘Available Data Sources’ on the left side, and ‘Selected Tables’ on the right side.
In the list of ‘Available Data Sources’, you first expand the branch named ‘Create New Connection’. This is done either by clicking the small plus sign or by double-clicking it with the mouse.
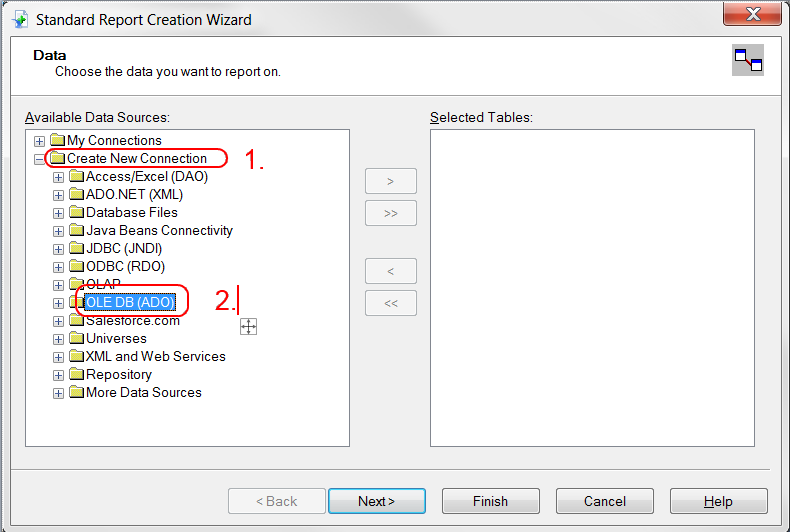
Next, you should expand the ‘OLE DB (ADO)’ branch. A new window-window titled OLE DB (ADO) will appear. This window is used to set up the connection to the database.
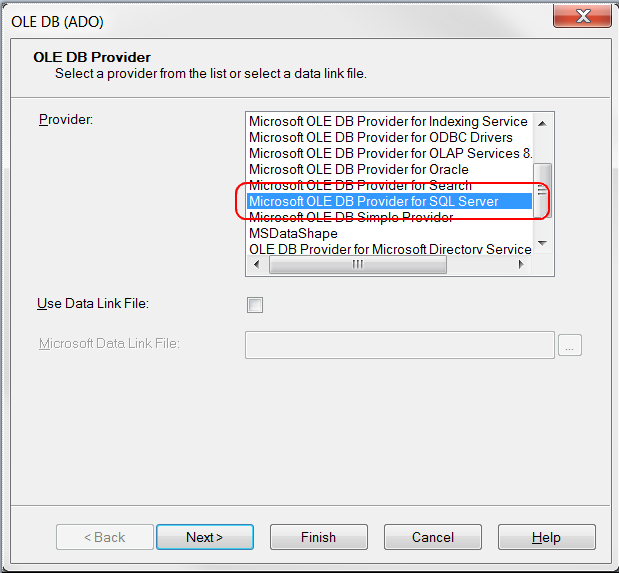
In the ‘Provider’- list, you should select ‘Microsoft OLE DB Provider for SQL Server’. Click the Next button to continue.
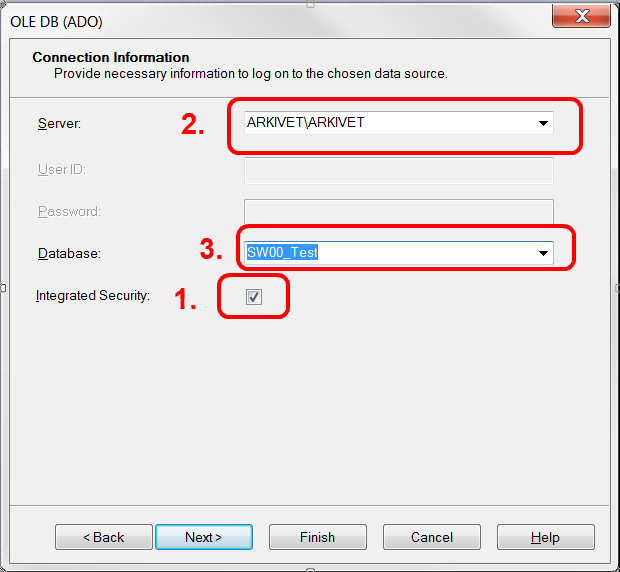
Now you will be asked to provide the necessary information to log on to the data source.
The first thing you need to do is to check the ‘Integrated Security’ button. When ‘Integrated security’ is selected, Crystal Reports will connect to the SQL database using your Window username and password. Now you will not need to enter the ‘User ID’ and ‘Password’.
Next, you should enter the name of the SQL server in the ‘Server’ field. Make sure to ask your database administrator for the name of the server containing the ShipWeight databases.
Now, select one of the available databases from the ‘Database’ dropdown list. Databases starting with SW0 are project databases.
Click the Finish button to close the ‘OLE DB’ window.
Back in the wizard, you will now find the database in the ‘Data Sources’ tree.
Double-click on the database name to expand the branch. Next, expand the ‘dbo’ branch. A list of the available tables will appear.
Now you need to drag-and-drop the ‘ITEM’-table’ to the ‘Selected Tables’ list at the right side.
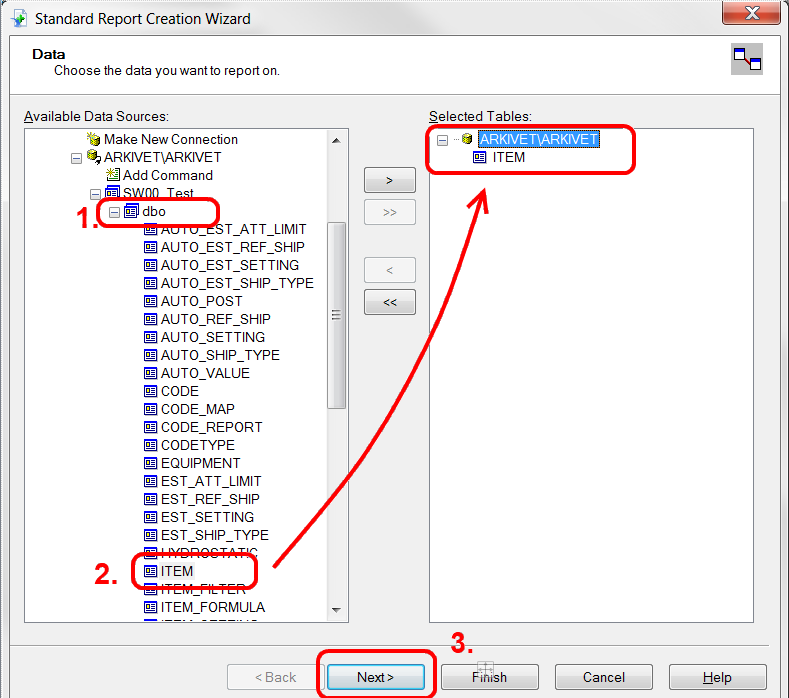
Click the Next button.
The next step of the wizard is to choose the fields to display in the report.
The wizard now shows two lists: ‘Available Fields’ and ‘Fields to Display’. The Available Fields list shows all the fields in the ITEM table.
To include fields in the report, simply drag-and-drop them to the ‘Fields to Display’ list.
You can re-arrange the order of the selected fields by simply dragging them to a new location in the ‘Fields to Display’-list.
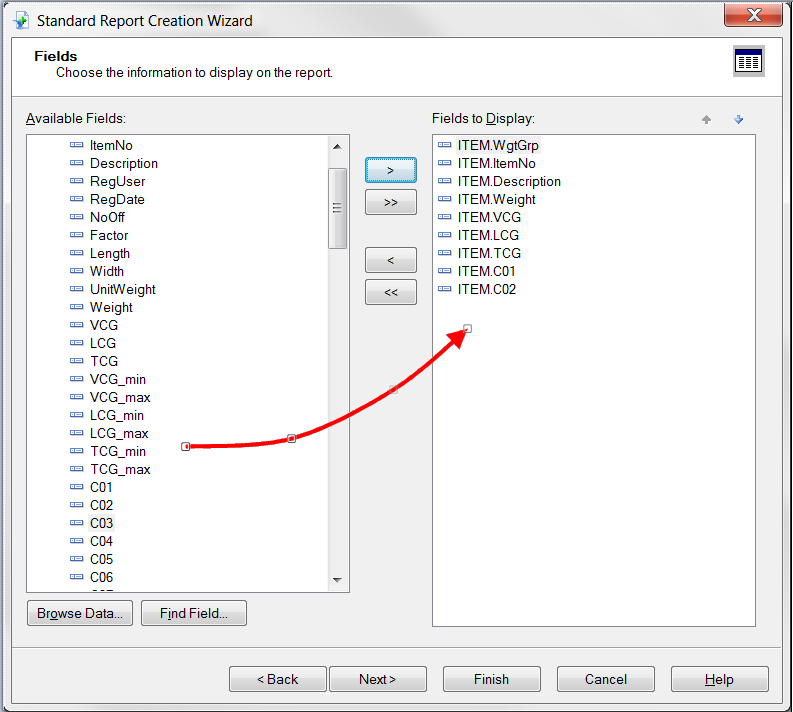
When you have selected the data you want in the report, click the Next button to continue to Grouping.
If you want to group the data in the report, simply drag-and-drop this field from the ‘Available’-list to the ‘Group By’ list.
In this example we will group on code C01, which is a Section code.
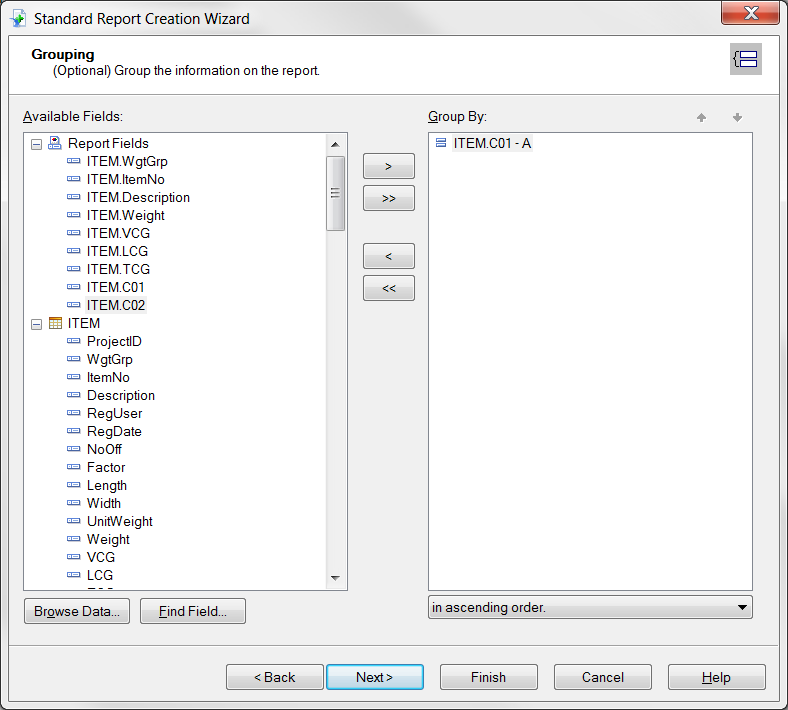
Click Next to go to the Summaries-part of the Wizard.
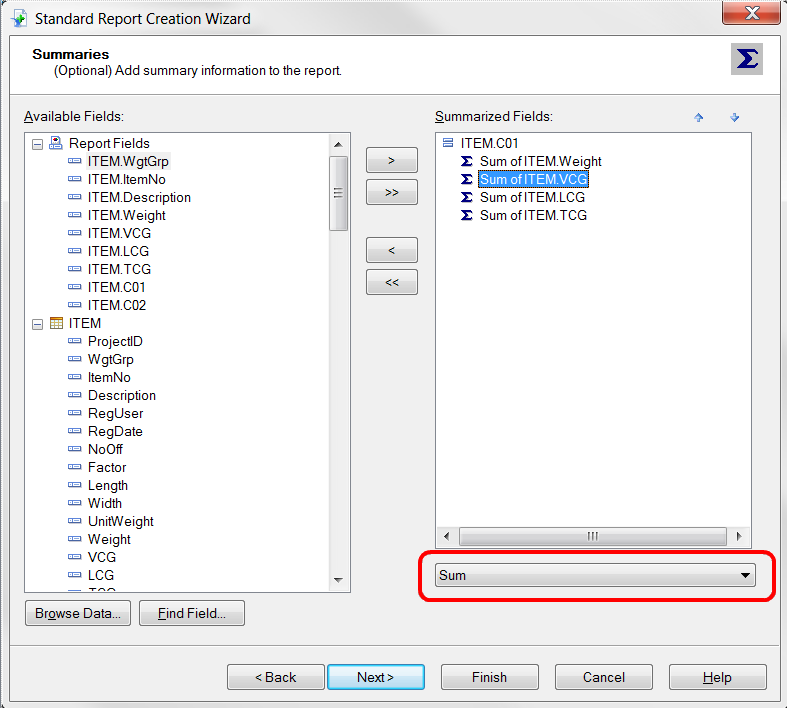
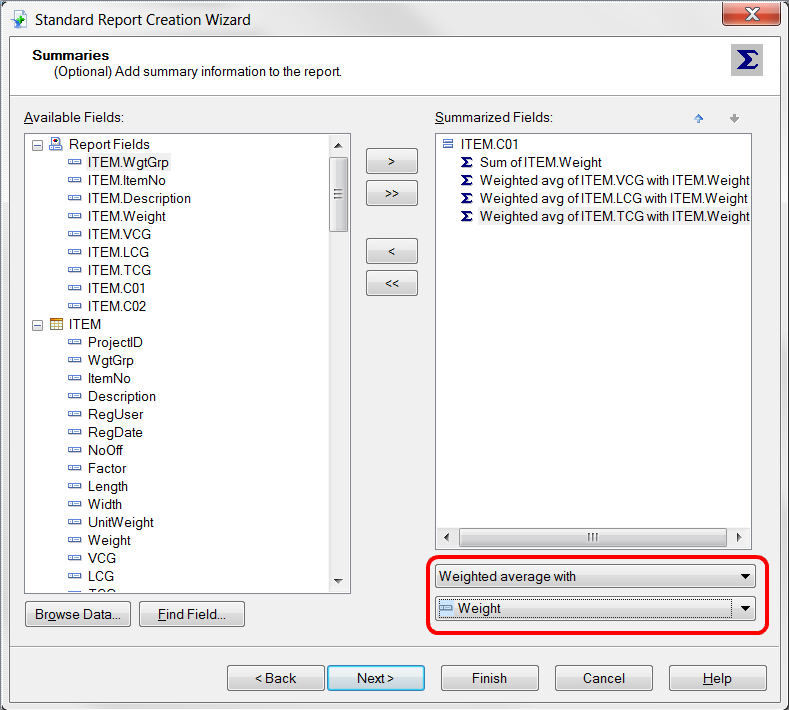
To add summary information to the report, simply drag-and-drop the field to the ‘Summarized Fields’-list.
All numerical fields in the report are automatically added to the ‘Summarized Fields’-list.
Please note that the default type of summary is Sum. Make sure to change summary type for VCG, LCG and TCG from ‘Sum’ to ‘Weighted average with Weight’.
When you click the Next button, you come to the Group Sorting. We will not use group sorting in this example, so you should click the Next button once more to go to the Chart-section of the Wizard.
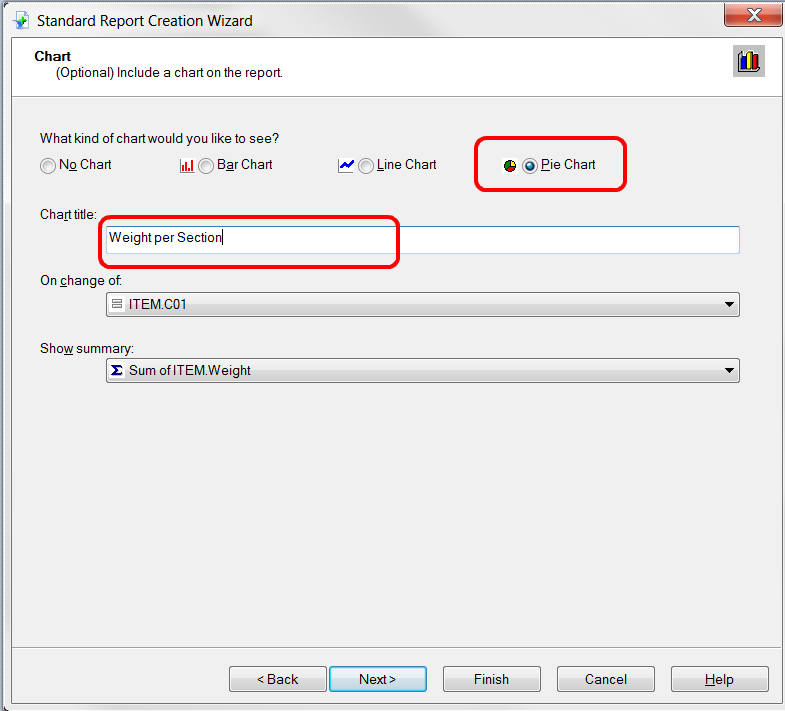
We will include a Pie Chart showing the Weight of each section. Select Pie Chart. Optionally you can change the Chart title.
Make sure the On change of field is set to ITEM.C01, which is our Section code in this example. Also check that Show summary is set to Sum of ITEM.Weight.
Click Next to go to Record Selection. You can use record selection to include only a part of the data from the database in the report.
We will not be using record selection in this example. Click Next to continue to the last item in the wizard: Template.
Crystal Reports comes with a set of predefined templates. You can use one of these to quickly change the look of your report.
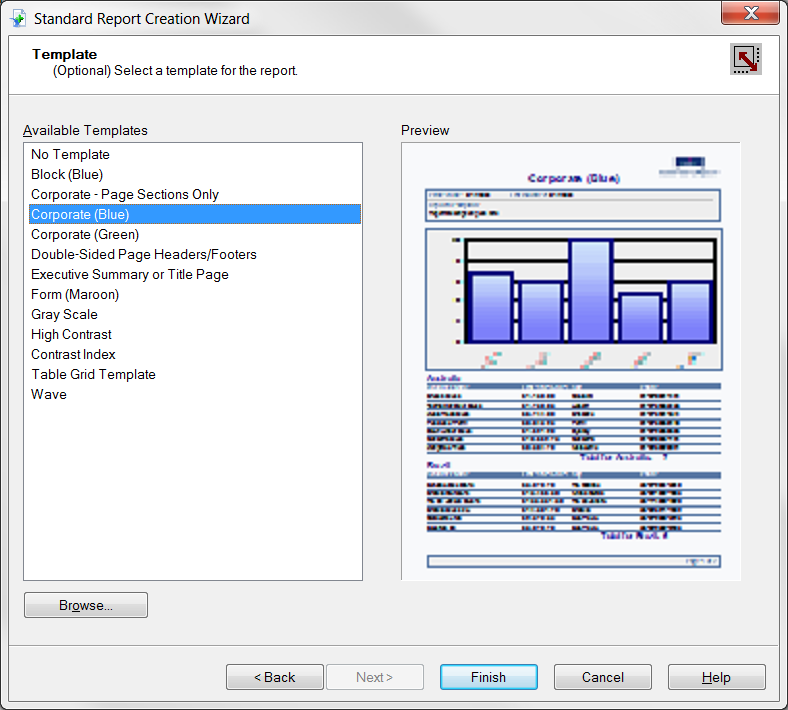
Click the Finish button to exit the Report Creation Wizard.
Step 2: Create a Project ID Filter
Each project database can contain several projects. The report will now include data from all projects on the database. To list data from the current project only, it is necessary to insert a filter.
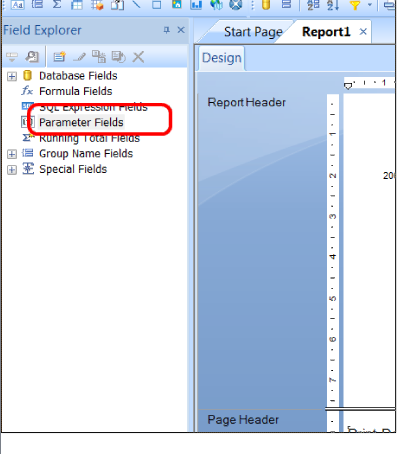
First, we will insert a parameter field to prompt for the current project name. Click Parameter Fields in the Field Explorer with the right mouse button. If the Field Explorer is not present, get it from the View menu. From the right-click menu, select New…
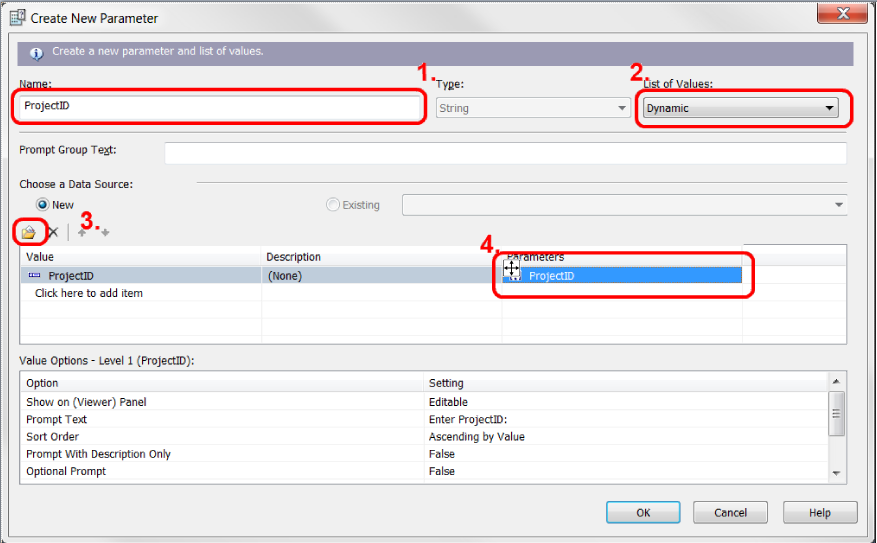
In the Create New Parameter window, enter ProjectID (1.) as the name of the parameter.
To add a dynamic list of values to the ProjectID parameter, select Dynamic (2.). You then click the Insert button (3.), and select ProjectID from the dropdown list. In the Parameters column, click on the text Click to create parameter (4.). The text will change to ProjectID.
Click the OK button to close the Create New Parameter window.
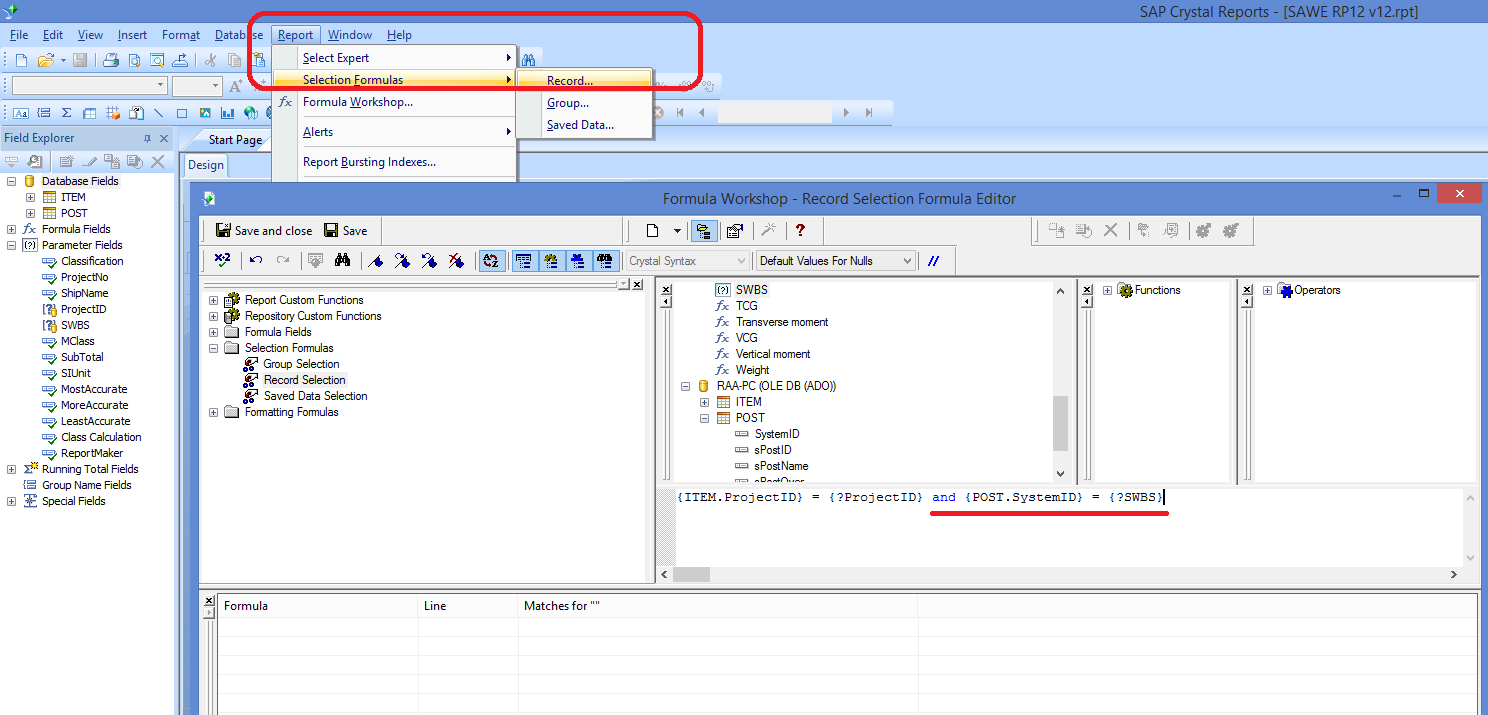
Now we are ready to create the data filter. This is done by creating a Record Selection formula. Choose Selection Formulas and then Record… on the Report menu.
In the Report Fields list of the Formula editor, expand the database and the item table. Select the database field ProjectID with the mouse, and drag it into the formula text window.
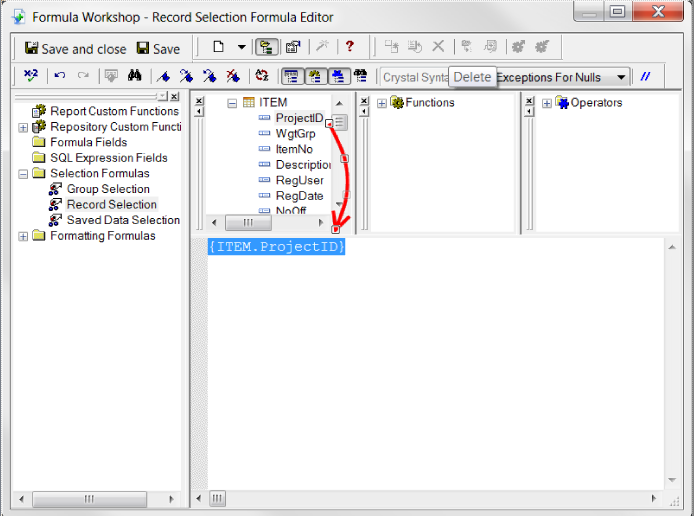
In the formula text window, type the sign of equality (1.) after the text {ITEM.ProjectID}.
Select the parameter named ProjectID (marked with a question mark icon in the list) in the ‘Report Fields’ branch. Drag and drop it to the formula text window (2.).
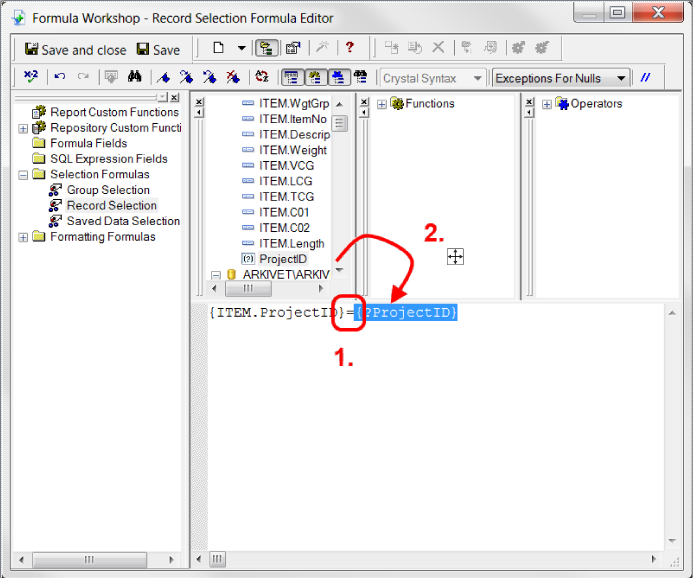
The selection formula should look like this:
{ITEM.ProjectID}={?ProjectID}
Click the Save and close button. The report data will now be filtered to include the selected ProjectID only.
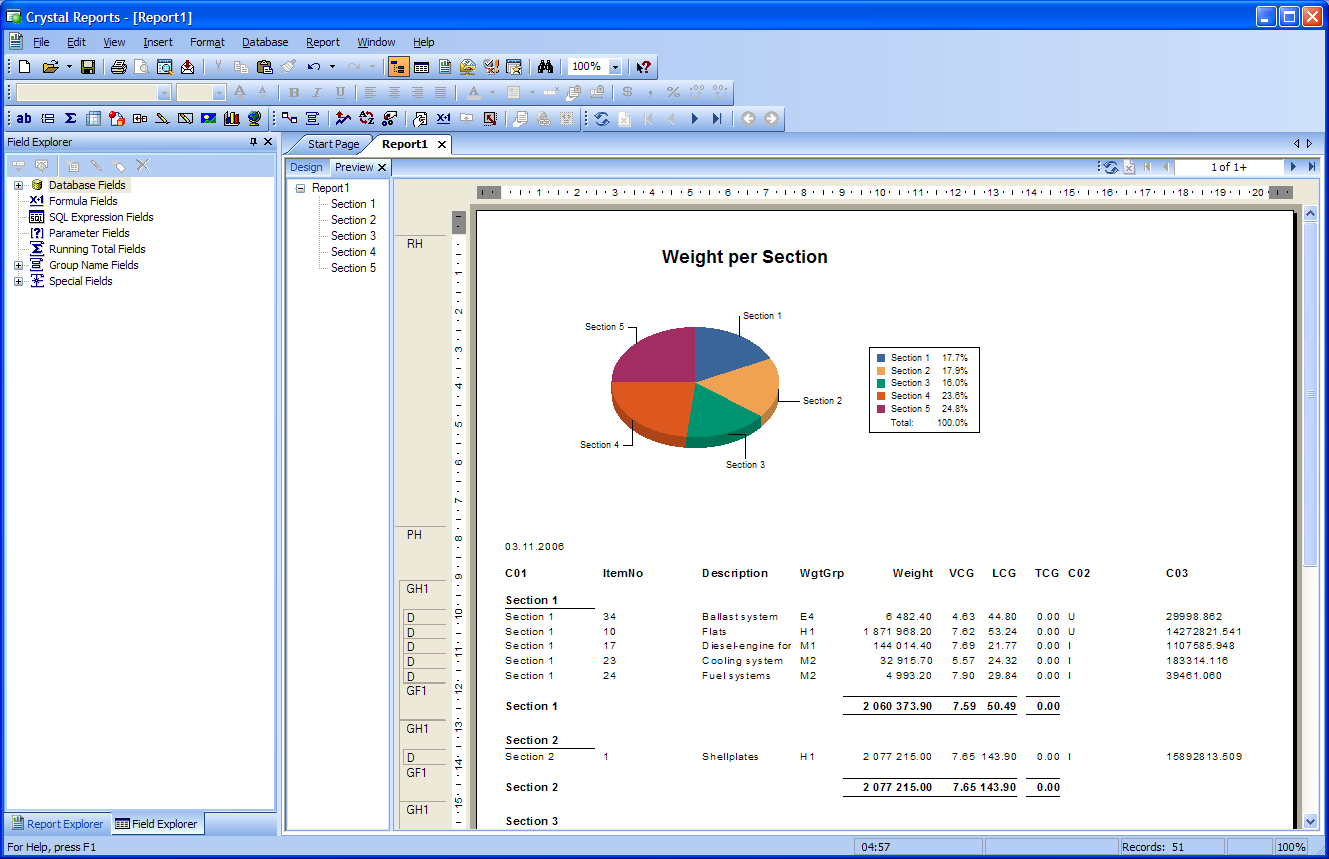
The preview shows that the report needs some formatting.
Some of the fields are too short to display the number. The easiest way to fix this is to click on the field in the preview area and expand it using the mouse.
The group summary fields are in the wrong position. Drag and drop them into place.
To switch between preview and design mode, simply click the tab in the top left corner of the preview/design area.
Step 4: Displaying Values in a Different Unit
Next, we want to display the data in US-units. In the database, all data are stored in metric units.
Since the database does not contain any data in US-units, you need to create a formula to convert the value from metric to US units.
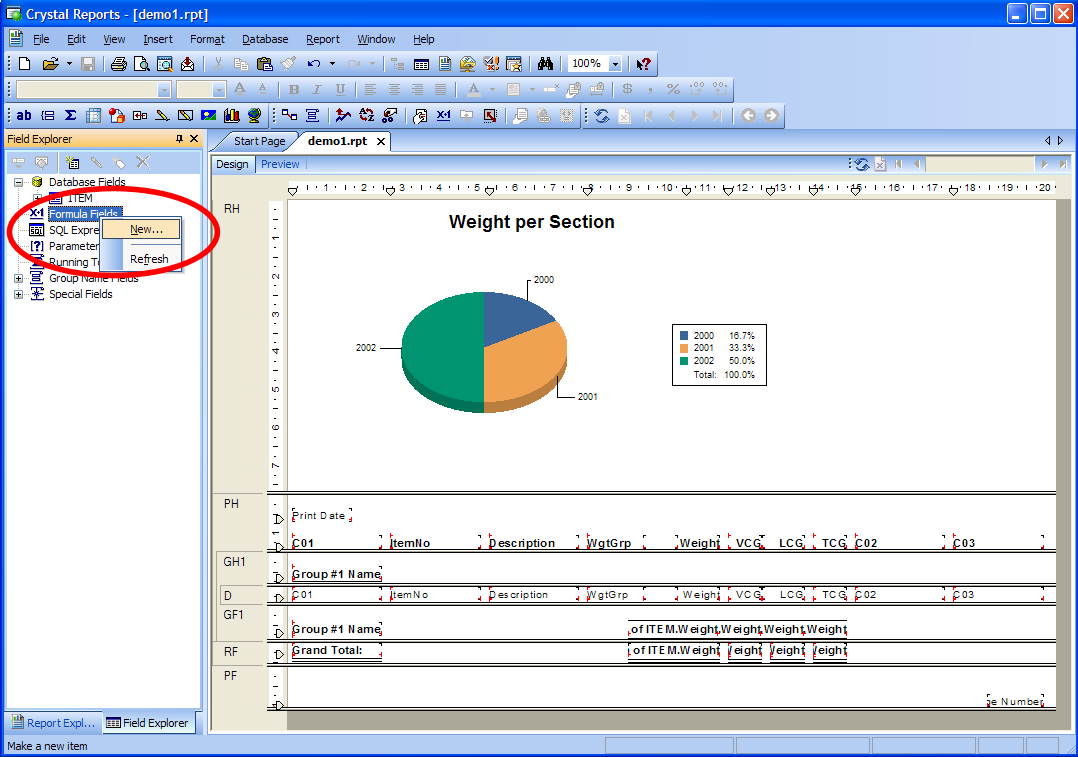
To create a new formula, you can right-click the Formula Fields in the Field Explorer. Select New…
Enter the name of the formula: ‘US Weight’.
Now the Formula Editor will appear.
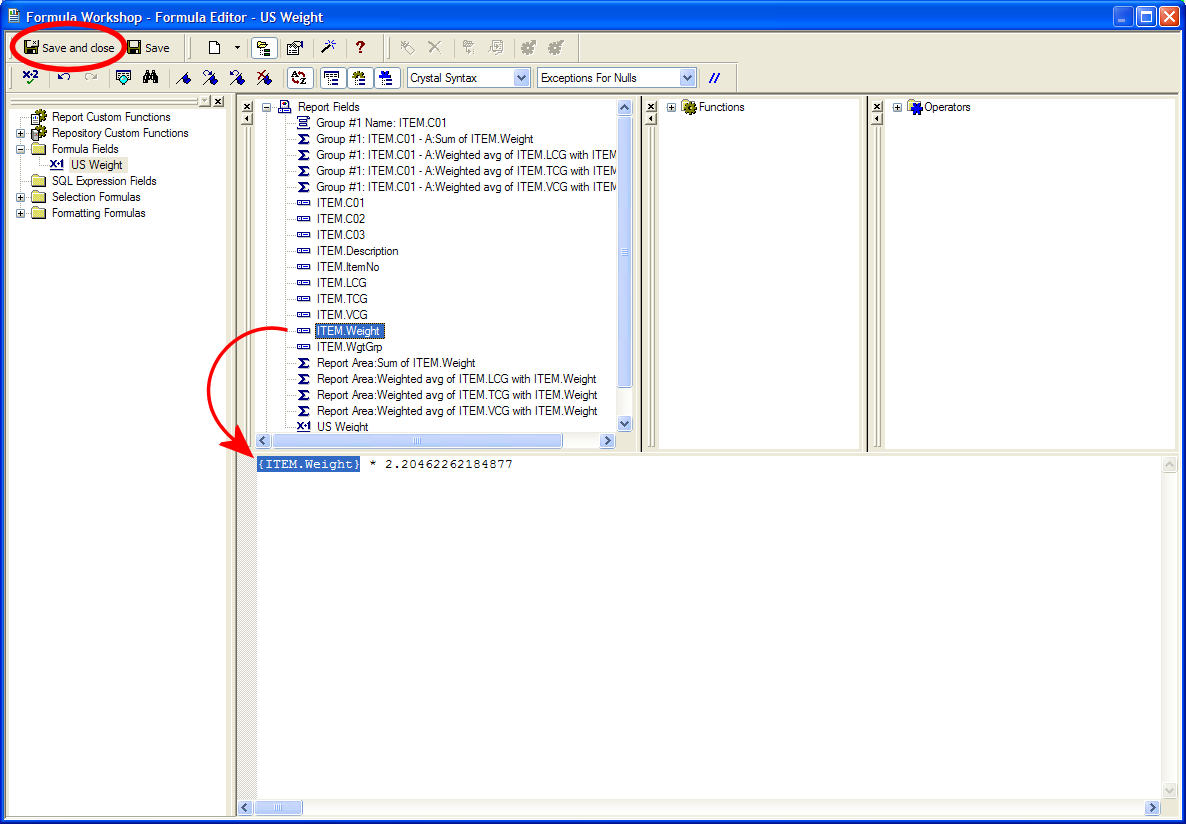
In the Formula editor, you will find a list of the available fields. Expand the branch ‘Report Fields’. Drag-and-drop the field ‘ITEM.Weight’, into the formula editor.
Finish the formula by entering the multiplication sign (asterisk) and the conversion factor. The formula to convert from kg to lb should be:
{ITEM.Weight} * 2.20462262184877
Click the Save and close button on the toolbar.
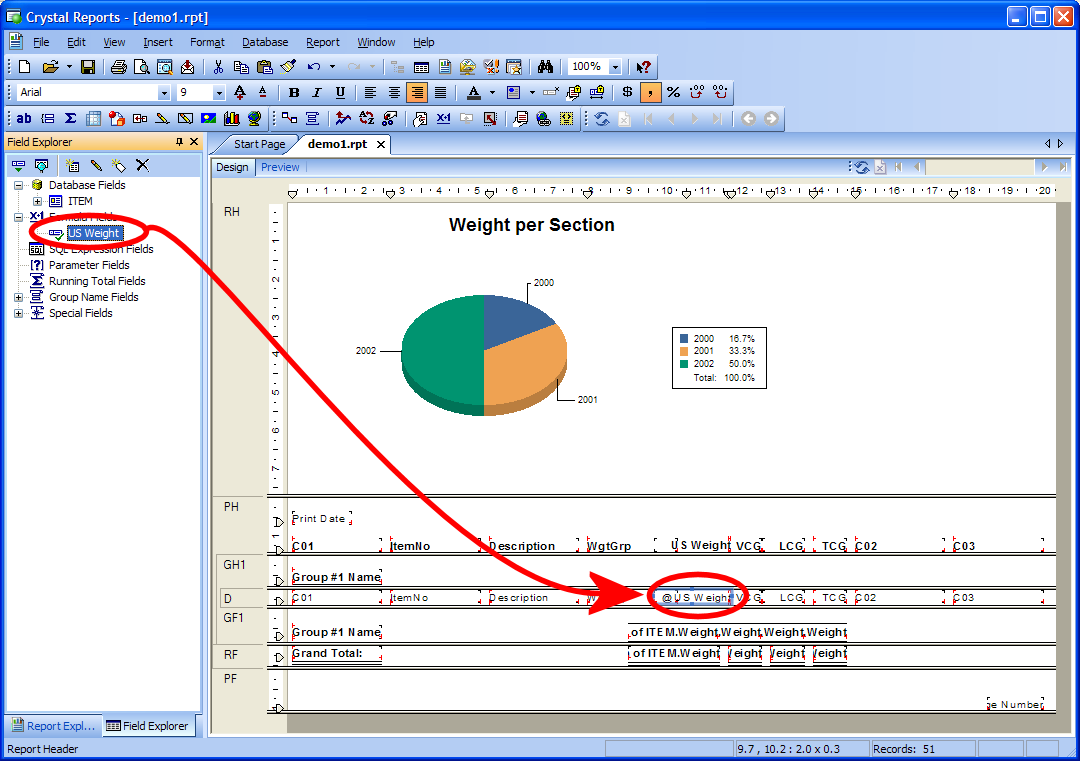
Back in the main window of Crystal Reports, you will find the new formula under ‘Formula fields’ in the ‘Field Explorer’.
Before you insert the ‘US Weight’ field, you need to delete the original weight field from the report. Simply select the field in the design view, and click the Delete button.
Now, you need to drag-and-drop the ‘US Weight’ formula into the Details section of the report.
Finally, you must change the summary fields to summarize the ‘US Weight’ formula instead of the ‘Weight’ database-field.
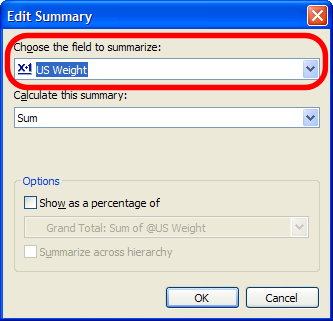
To do this, select the Group Summary field in the design view, and click on it with the right mouse button. Select Edit Summary from the dropdown menu.
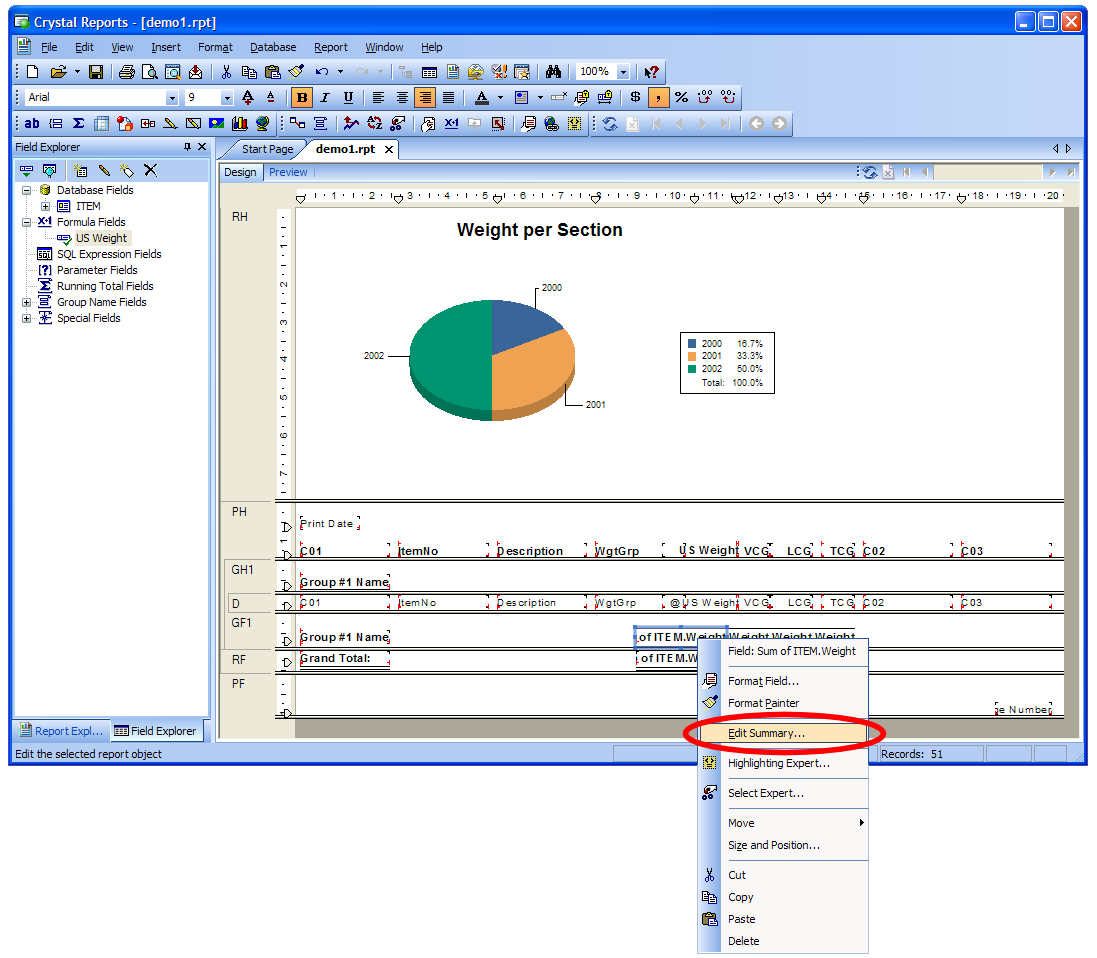
The ‘Edit Summary’-window pops up. Select US Weight in the Choose the field to summarize ListBox. Click OK to close the window. Repeat this for the Report Summary.
The report now shows the weight in pounds instead of kilograms.
Step 5: Summarizing a Custom Code
In the project we have used, Code C03 is the Vertical Moment. We would like to summarize the moments.
Crystal Reports can only summarize numerical fields. And since ShipWeight stores the code values as strings, you cannot summarize code values directly.
The solution is to create a formula that converts the string C03 into a numerical value.
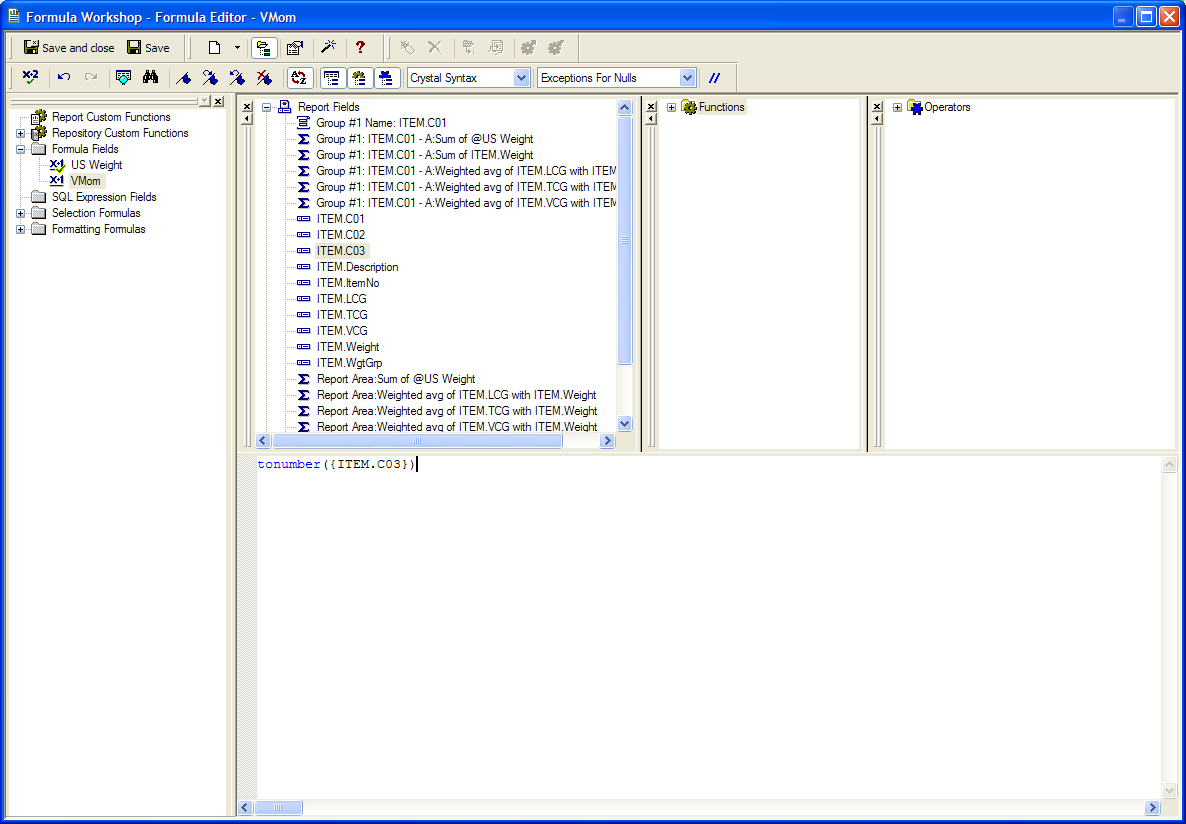
Create a new formula named ‘VMom’. In the Formula Editor drag-and-drop the field ITEM.C03 into the editor.
To convert a string to a number, you need to use a Crystal-Reports function named TONUMBER(). The formula should look like this:
tonumber({ITEM.C03})
Now, the formula ‘VMom’ is available in the ‘Field Explorer’.
In the design area, select and delete the field ‘C03’. Then drag the formula ‘VMom’ into the report.
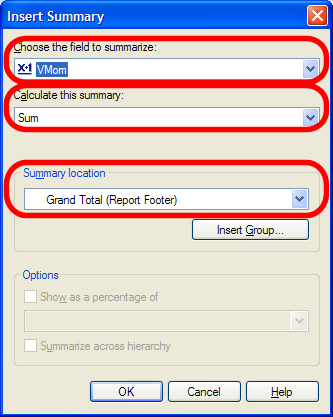
To insert a summary of the Vertical Moment, choose Insert Summary from the Insert menu.
Now the Insert Summary window will appear. First, select ‘VMom’ in the ‘Choose the field to summarize’ list box.
Then make sure the Calculate this summary option is set to ‘Sum’.
Finally, set ‘Summary Location’ to ‘Grand Total (Report Footer)’
In the same way, insert a Group summary. Hint: in the ‘Insert Summary’ window, you will need to set the ‘Summary location’ to ‘Group #1: ITEM.C01 – A’
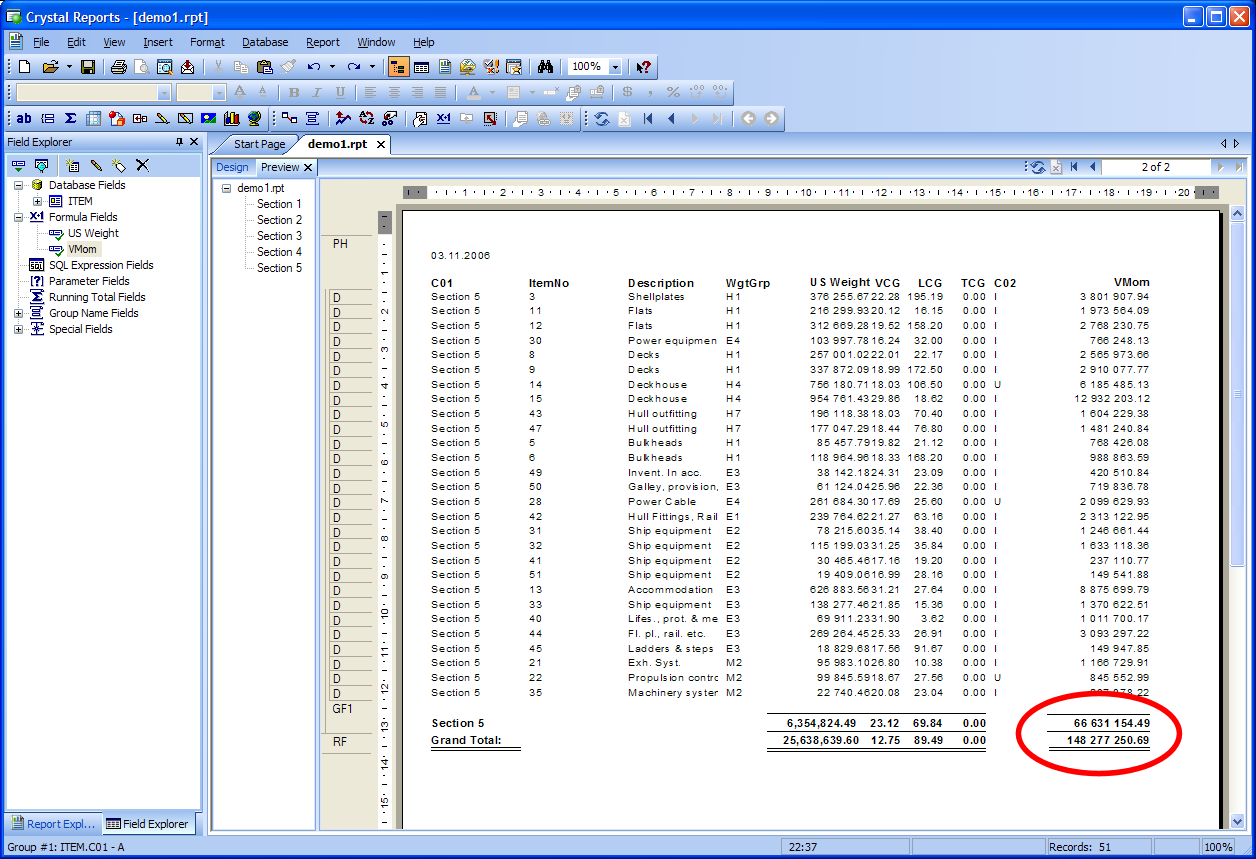
Now, you successfully have inserted a summary of code values into your report. Click the Preview tab to see the result.
Step 6: Set a WBS Filter Parameter if Using SWSystem Tables
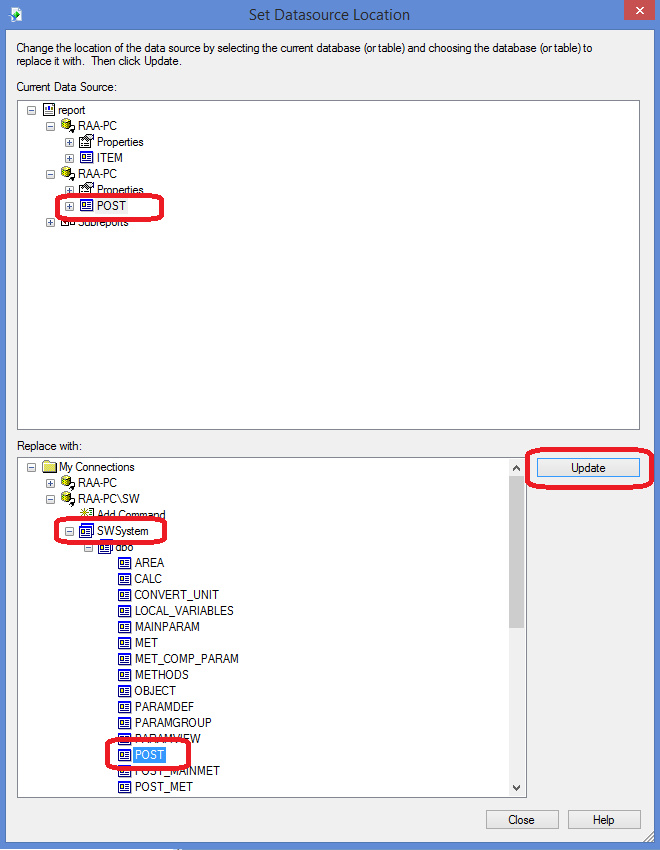
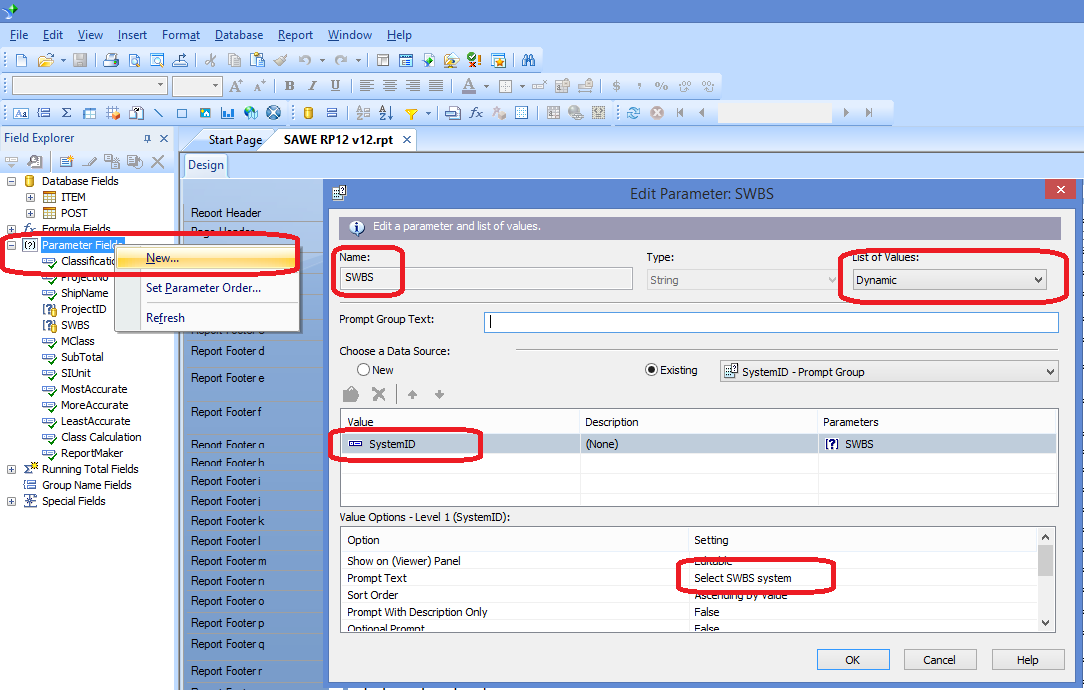
Create a new selection parameter “SWBS” in the report
Add a selection formula to the record selection in a the main report (unless only subreports):