Under the Graph menu in the Estimation window, many options are available for displaying different information in the graph.
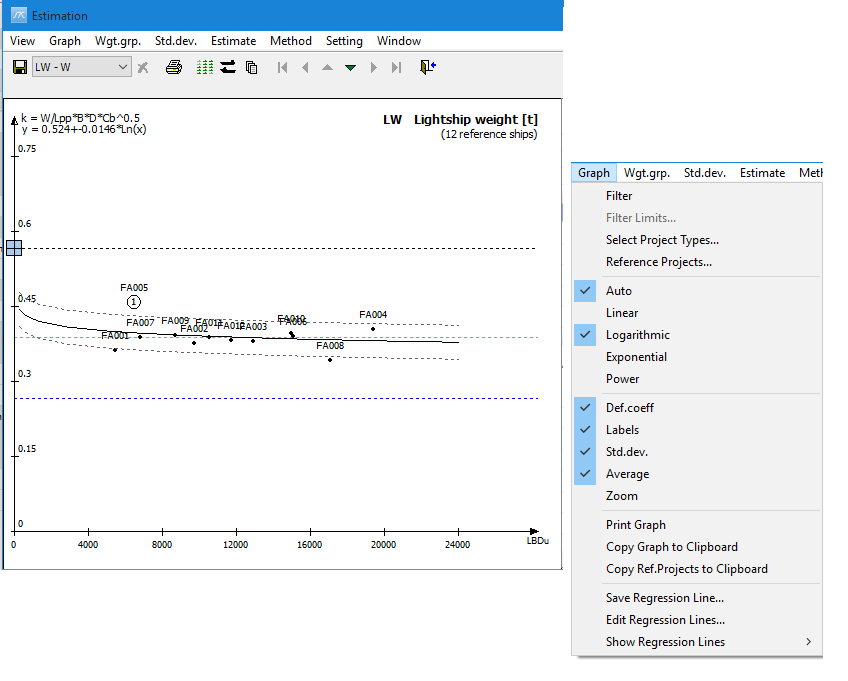
Most important are the regression line and the choices regarding the regression type. If Auto is checked in the menu, the system chooses the regression line that gives the lowest standard deviation coefficient. However, it is important to remember that if the number of coefficients is low, it might be wise to judge yourself if other types of regression line are more appropriate. By ticking off the Auto option, the user is free to decide whether linear, logarithmic, exponential or power regression should be used.
Other useful options in the Graph menu are options to view default coefficient, labels, standard deviation and average coefficient. A blue- and a green dotted line in the graph display the default and average coefficient. The label option will label the coefficients plotted in the graph with the ID (filename) of the project. The two gray lines display the standard deviation.