One of the main features of ShipWeight is the possibility to do logical selections of the coefficients to be plotted in the graph. This makes it easy to plot only the relevant coefficients in the graph and thus obtain a good regression line and a good coefficient for estimating.
The first and natural way to filter the coefficients is to select which project types are to be plotted. Selecting Project Types… under Graph in the Estimation Window menu bar let you do this. Alternatively, click the Project Type button in the Estimation Window.
![]()
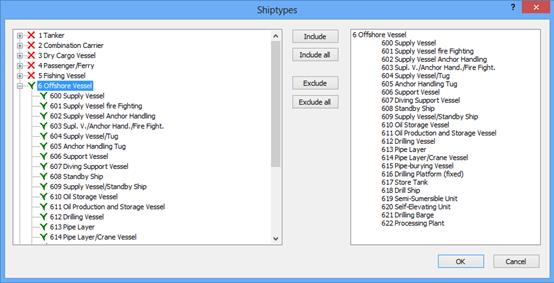
As a default, all the project types under the main project type equal to the project’s main project type are selected. By navigating in the tree-structure, using the Include and Exclude buttons, project types can be selected or deselected from the plot. When you are set, click Close to go back to the Graph.
The other way to put constraints on the coefficients to be plotted is to select a comparison parameter in the grid table fields in the Comparison area, and then select Filter limits… under Graph in the Estimation window menu bar.
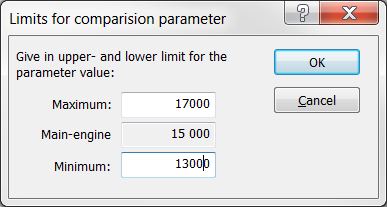
In this window you can set the upper and lower limit for the comparison parameter you have selected. Only projcects with parameter value within the given limits will be plotted.
Remember to set both upper and lower limits.
When you are satisfied with the selected coefficients and have estimated the weight and standard deviation you can go on with the estimation by one of the following options:
Estimate VCG and LCG for that weight group by selecting VCG or LCG in Estimate in the menu bar.
Do estimation on another weight group by navigating by selections in the Weight group menu in the Estimation Window.
Return to the main window by closing the window, navigate to another weight group in the main window, and then open the Estimation Window, now with the new weight group in focus.
To ensure an efficient use of time, selecting the Most uncertain function from Weight group in the menu bar in the main window will guide you to a new weight group. Further splitting and estimation on lower levels of this weight group will give the greatest impact on the total lightweight. This works only if standard deviations have been calculated for each weight group estimated earlier.